Refik Hadzialic
This article should teach you how to build a simple heart monitoring device, ECG/EKG (electrocardiograph). Before I continue to explain what I did, I would like to WARN you! 500 mA on 220 V will completely destroy your nervous system (so run it from battery supply), check everything twice and you are responsible for it on you own.
The depolarising field in the heart is a vector which alters its direction and magnitude through the cardiac cycle. The placement of the electrodes on the surface of a patient determines the view which will be obtained of that vector as a function of time. The most commonly used electrode placement scheme is shown in Figure 1. Here the differential potential is measured between the right and left arm, between the right arm and the left leg and between left arm and left leg. These three measurements are referred to as leads I, II, III respectively. This measurement lead placement was developed by Einthoven who stated that through measurement of lead I and lead II the signal seen at lead III could be calculated. This is the most basic form of ECG lead placement: from this the various features of the heart’s depolarisation can be calculated. Clinically there is a range of lead placement schemes which incorporate limb leads and chest leads.
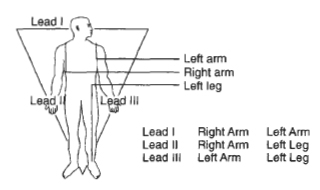
Figure 1
Therefore the ECG waveform shows the clinician the electrical waveforms associated with the contraction of the atria and ventricles. From an ECG a clinician may determine the relative timing of the contractions of the atria and the ventricles and assess the relative amplitude of the atrial and ventricular depolarisation and repolarisation. This information may allow the identification of mild heart block. Following a heart attack a patient’s ECG shows changes as the timing and shape of the waveform are dependent on the transmission of the waveform through the muscle tissue. This changes with ischaemic muscle damage associated with heart attacks.
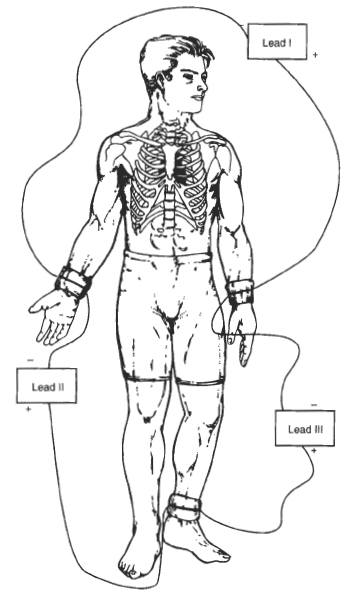
Figure 2, Connection diagram
The signal from the body is being amplified (the signals from the body are small and weak, ranging from 0.5 mV to 5.0 mV), filtered (to remove the noise), sampled (by sampling I mean it goes to an Analog to Digital converter aka ADC) and then sent to your computer through RS232 (wireless or any other way but RS232 was chosen because it is the simplest and fastest to make). The first two steps are shown in Figure 3.
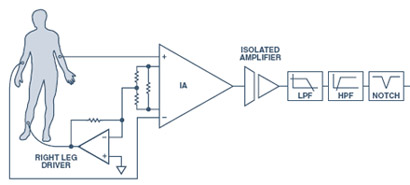
Figure 3, ECG Chain
The amplifiers we use in biomedical engineering, data acquisition or where the signal of interest is represented by a small voltage fluctuation superimposed on a voltage offset are called Instrumentation amplifiers. Instrumentation amplifiers have a high CMRR (Common Mode Rejection Ratio) which means they have the ability of a differential amplifier to not pass (reject) the portion of the signal common to both the + and – inputs. The famous producers of Instrumentation amplifiers are Texas Instruments and Analog Devices. I used the amplifiers from the second company, Analog Devices. The AD620, instrumentation amplifier, and OP97, a high precision operational amplifier. As they require negative voltage supply I generated it with the Linear LTC1044, switched capacitor voltage converter, Figure 4. The supplied voltage was 5 V. The schematic is shown on Figure 5, and it was taken from this datasheet where it is explained in more details.
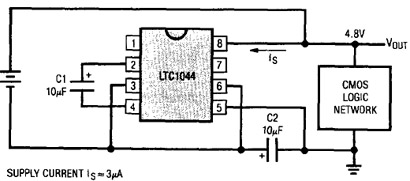
Figure 4. LTC1044, negative voltage generator
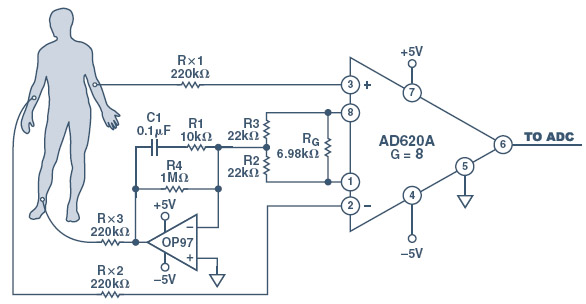
Figure 5, ECG Schematic
The noise comes from muscle contractions, power line interference 50-60 Hz, electrode contact noise, noise from other electronic devices and etc. The filter for the ECG application should be a notch filter(high-pass and low-pass filter). It should filter in the range from 0.5 Hz to 50 Hz. I created a simple RC highpass and lowpass filter, in series connected (just two capacitors and resistors).
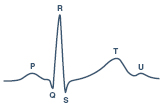
Figure 6, ECG Signal
The ADC I used was an internal ADC from an Atmel MCU, ATMega8. The code is here.
I used LABView to see the ECG of my heart.
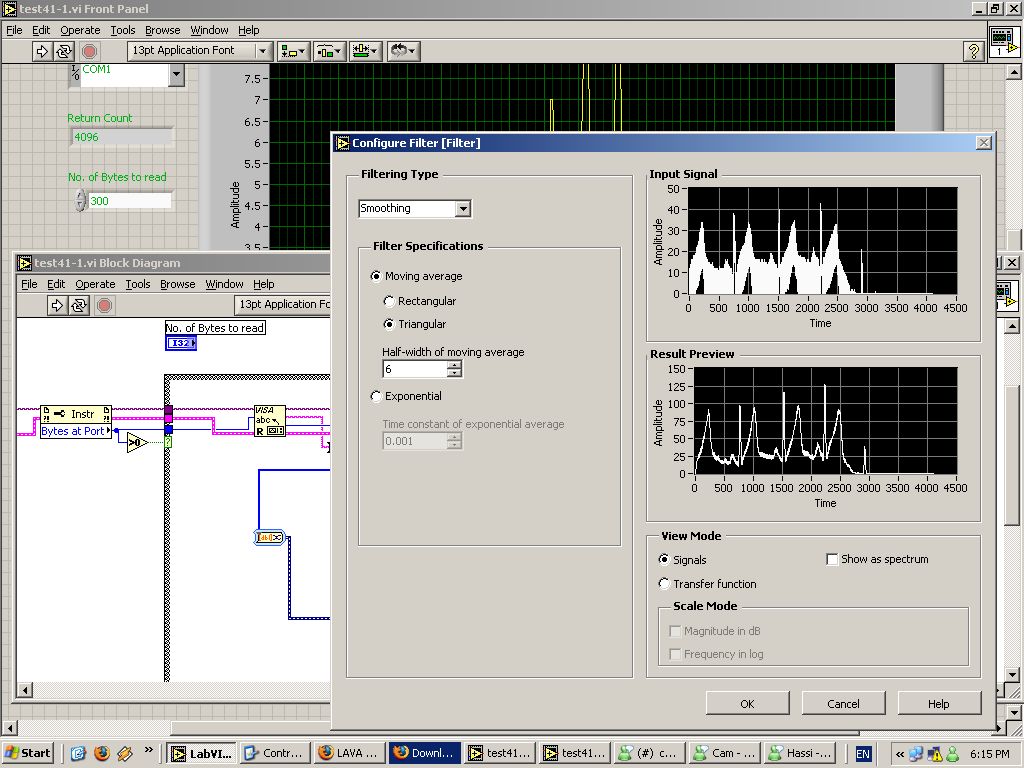
Figure 7, ECG Results in LABView (click on the picture for a larger version)
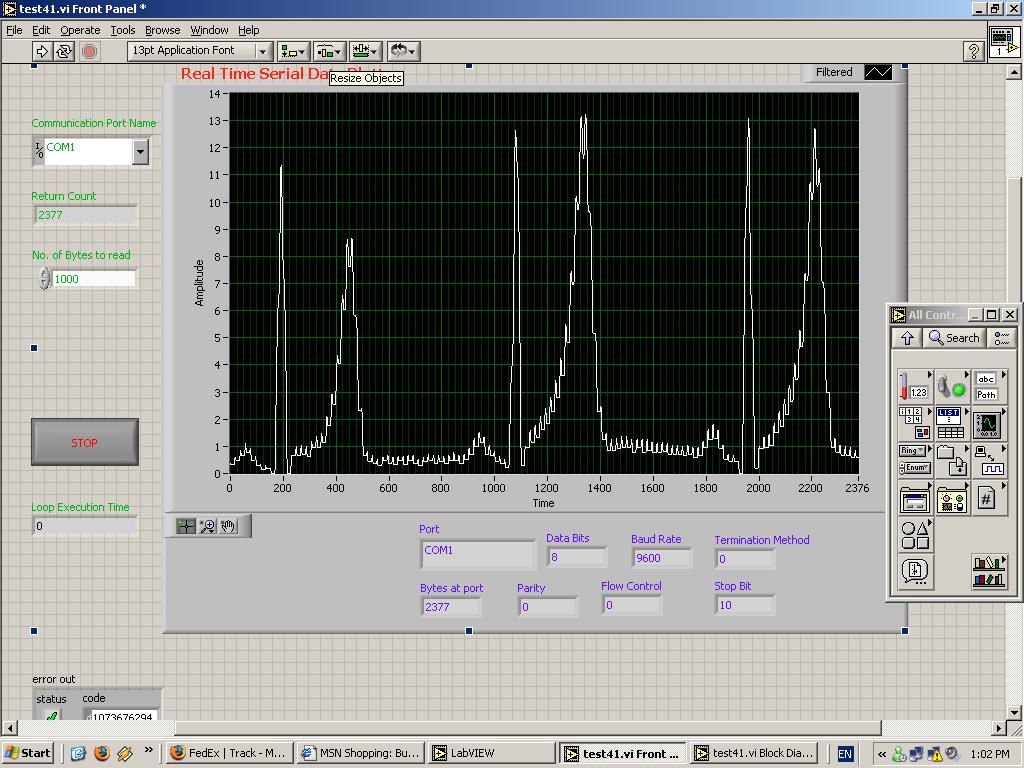
Figure 8, ECG Results in LABView (click on the picture for a larger version)
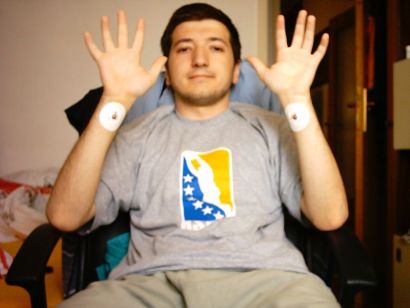
Figure 9, That’s me with the electrodes
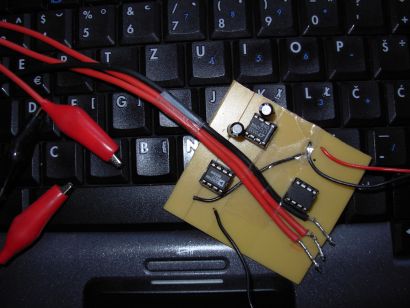
Figure 10, ECG board that I created myself, front
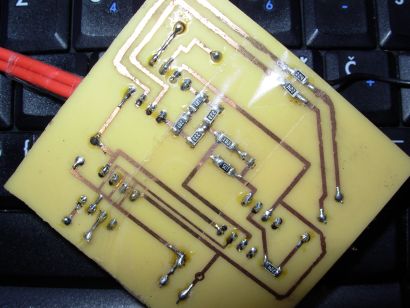
Figure 11, ECG board, back