Jeff Magee
It is emphasised that this should not be used for medical purposes.
Displays your pulse rate, blood oxygen level and a moving graph of each heart beat, the photoplethysmogram (PPG).
About this project
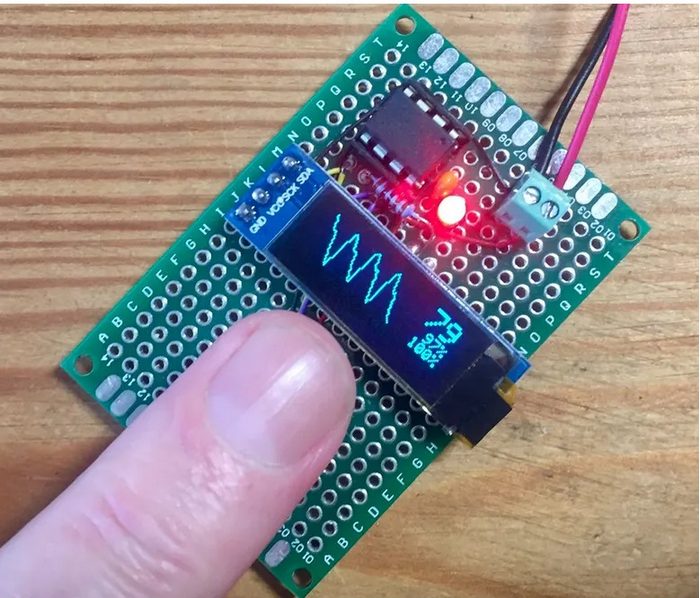
This project implemented on an ATtiny85 displays a moving Photoplethysmogram together with pulse rate and estimates of SpO2 - blood oxygen percentage (Figure 1). It uses an SSD1306 128×32 OLED display and a MAX30102 sensor. It is emphasised that this should not be used for medical purposes. The computation of SpO2 is very approximate and not calibrated in any way. The project is an exercise in seeing how much functionality can be implemented using a processor with only 512 bytes of RAM. This means that samples from the MAX30102 sensor must be processed on the fly. Most of the existing Arduino programs read in a block of 100 or so samples and then process them.
 |
|
| Figure 1. | ATtiny85 Pulse Oximeter and Photoplethysmograph. |
Hardware
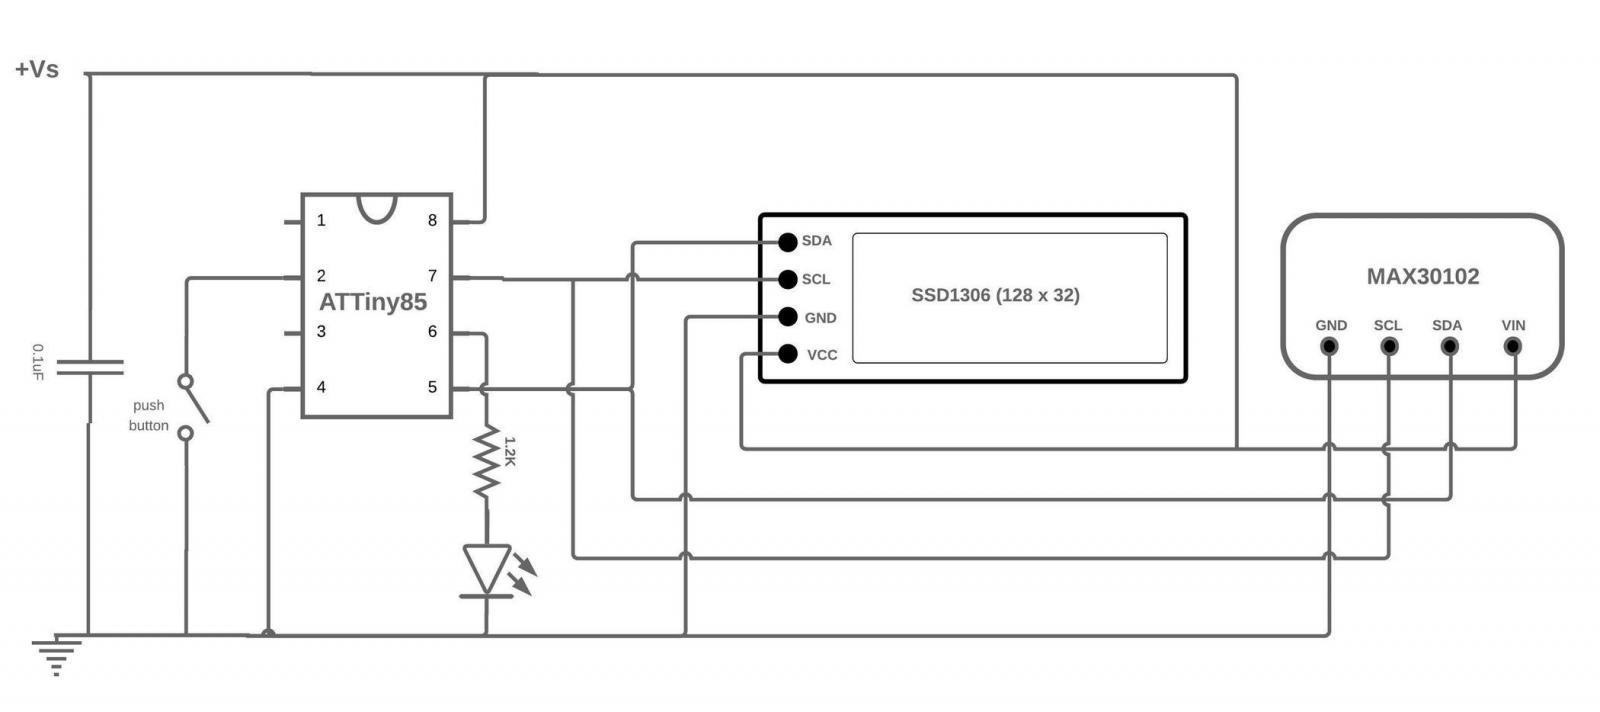
I implemented the hardware on a prototyping board as shown below, however, the components could equally well be assembled on a breadboard according to the circuit diagram shown in Figure 2.
 |
|
| Figure 2. | ATtiny85 Pulse Oximeter and Photoplethysmograph Schematic Diagram. |
The ATtiny85 is configured to run at 16 MHz using Spence Konde's ATtinyCore (see [1] for details of how to configure and load Arduino programs into an ATtiny85). Consequently, according to the datasheet, the supply voltage should be >4.5 V. In fact, it seems to run quite happily from a lipo battery (3.7 - 4.2 V).
Operation
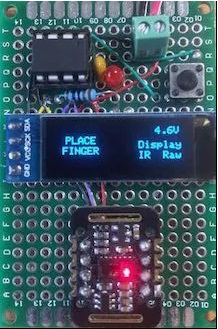
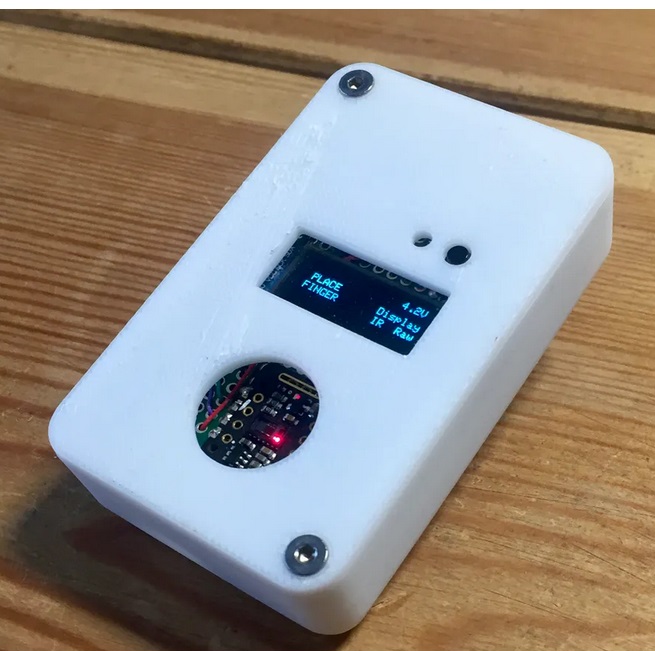
After a few seconds the screen shown on Figure 3 is displayed.
 |
|
| Figure 3. | ATtiny85 Pulse Oximeter in RAW mode (unfiltered samples). |
When a finger is placed on the sensor, the PPG, heart-rate and two estimates of blood oxygen are displayed (discussed below). This can be seen in the following video clip:
The red LED pulses once per heart beat. The PPG display is updated every 50 ms. The video shows the waveform before it is passed to a moving average filter which smooths the waveform for peak/beat detection. The single button on the board wakes up the system when it goes to sleep after 10 seconds if a finger is not placed on the sensor and in addition it cycles through four options. The options allow a user to display the waveform detected from the red LEDD as well as that shown from the IR LED.
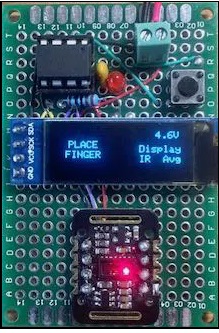
In the picture above, the option to display the waveform after it has passed through the moving average filter is chosen (Figure 4).
 |
|
| Figure 4. | ATtiny85 Pulse Oximeter in "Avg" mode (samples has passed through the moving average filter). |
Software Issues
Driver issue - The Maxim MAX30102 sensor used is mounted on a MH-ET LIVE breakout board. The Maxim datasheet for the MAX30102 implies but does not state explicitly that LED1 is Red and LED2 is Infrared (IR), however, if the amplitude of LED1 is set to zero, the red led (as depicted in the place finger) picture remains lit, while if LED2 is set to zero, the red led is extinguished. The obvious conclusion is that LED1 is IR and LED2 is Red (i.e. swapped) which also works when computing blood oxygen - see below. I mention this as the most common driver used in Arduino projects for the MAX30102 is the SparkFun 3010x driver which clearly identifies LED1 with Red and LED2 with IR. This may be true for the MAX30105 device mounted on the Sparkfun board but does not seem to apply to the MAX30102 on the MH-ET-LIVE board.
Spo2 calculation"SpO2 stands for peripheral capillary oxygen saturation, an estimate of the amount of oxygen in the blood. More specifically, it is the percentage of oxygenated haemoglobin (haemoglobin containing oxygen) compared to the total amount of haemoglobin in the blood (oxygenated and non-oxygenated haemoglobin)."
Oxygenated haemoglobin and deoxygenated haemoglobin have different light absorption characteristics for red and IR wavelengths. This is the basis for sensors like the MAX30102. The calculation uses the ratio:
R = (AC_red/DC_red)/(AC_IR/DC_IR)
where AC_xxx is the fluctuating component of the xxx signal and DC_xxx is the fixed component. tinyPulsePPG uses R in two different formulas. The upper percentage is from the classic formula:
R = 104 - 1.7 × R
The lower uses a table from the Maxim Arduino driver which is an approximation of the formula:
-45.060 × R × R + 30.354 × R + 94.845
The AC is computed in tinyPulsePPG as the peak to peak amplitude of the signal after the DC element has been removed. the DC element is computed by an exponential moving average filter and the AC is also filtered. I have not experimented enough with the constants in these filters to determine the effect on the SpO2 calculation or indeed how reliable this method is of computing these quantities.
PPG display The read and IR signals from the sensor go through two stages of filtering. The first as described above is removal of the DC element. The second is a moving average filter which acts as a low pass filter to remove transients before the signal is input to the beat detector. The waveform after each of this filters can be displayed, however, in general the unaveraged waveform is more interesting..
For example, dicrotic notches can be seen in project photograph and in the first video above - "a secondary upstroke in the descending part of a pulse tracing corresponding to the transient increase in aortic pressure upon closure of the aortic valve. - Merriam Webster Dictionary"
I have noticed that if this dicrotic notch is particularly strong - younger individuals - it can overcome the second stage filtering and cause erroneous output from the beat detector which essentially looks for peaks and valleys in the wave. Ongoing work!
Update
I have put another version of the software in the GitHub repository sub-directory nanoPulsePPG that runs on a standard AVR Arduino - tested on a Nano but should also work on an Uno so that you can easily experiment with the software and sensor. See Schematics section.
I have added a link to a repository containing the OpenScad and STL files for the case (Figure 5).
 |
|
| Figure 5. | Case for ATtiny85 Pulse Oximeter. |