The PV-pushback-effect with solar panels can control backup power and provide constant light output.
Solar day lamps (SDLs) are made by simply connecting an LED array to a solar photovoltaic (PV) panel. SDLs represent a highly cost-effective way of utilizing solar energy for lighting. However, SDLs suffer from drawbacks such as daytime-only lighting, light-intensity fluctuations based on sunlight intensity, and low output on cloudy or rainy days.
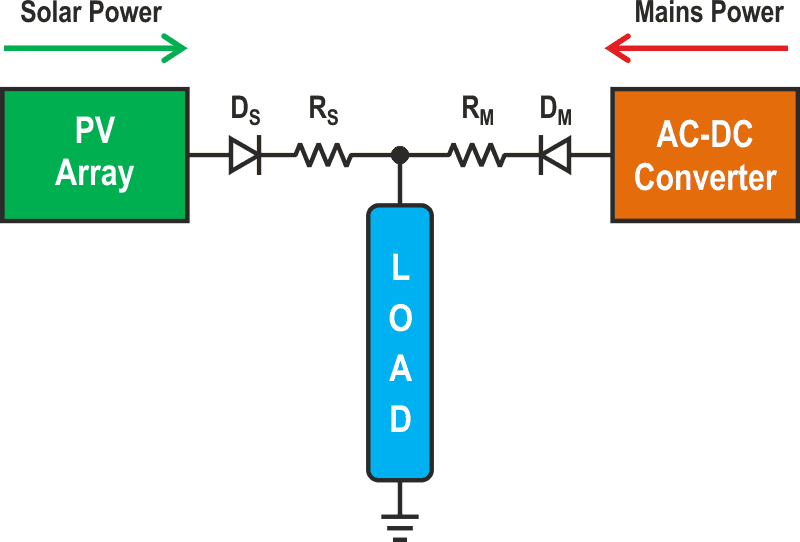
To eliminate those drawbacks, a simple mains backup system is proposed. Figure 1 shows the block diagram of solar lighting system using the PV-pushback-effect. It consists of a load (here, it’s an SDL) that’s fed from two sources. The first source is the solar PV power and the second source is mains power with an AC-DC converter. Before connecting these two power sources, a diode and resistor are connected in series with their respective output terminals. The diodes DS and DM ensure that the current from the other source is blocked.
 |
|
| Figure 1. | This solar lighting system uses the PV-pushback-effect to get constant light output. |
What is the PV-pushback-effect?
To understand the PV-pushback-effect, we must first look at the PV voltage characteristics, as the load resistance is varied. A simple test was carried out using a PV array with three panels connected in series. The load resistance was directly connected to the output terminals of PV array. Specifications of the PV panels include:
- Solar PV panel power rating (WP): 10 W
- Voltage at maximum power (VMP): 17.5 V
- Open circuit voltage of the panel (VOC): 21.2 V
- Current at maximum power (IMP): 0.58 A
- Number of series connected PV panels in the array: 3
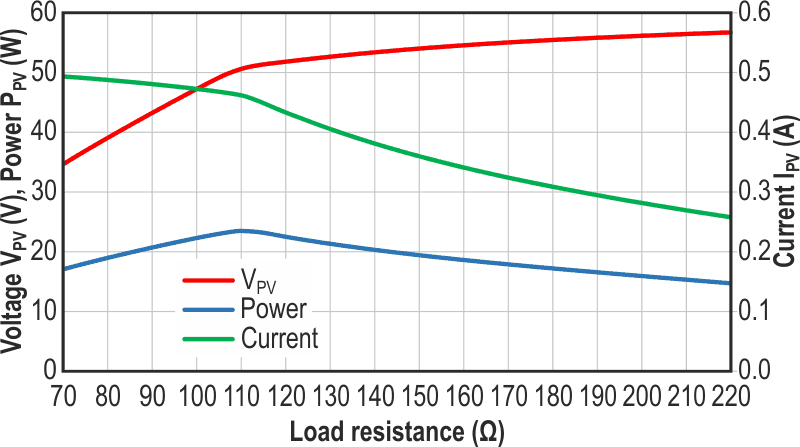
Figure 2 shows the plots of array parameters VPV, PPV, and IPV when the load resistance was varied from 70 to 220 Ω under constant sunlight intensity. The plot of PPV clearly shows that the maximum power was generated at 110 Ω. The maximum power point is a function of sunlight intensity and the operating temperature of the panels.
 |
|
| Figure 2. | The chart shows the characterization of the PV array under constant sunlight intensity. |
The array voltage VPV keeps on rising as the resistance is increased (initial slope is higher, beyond max power point, the slope is less). This monotonic increase in the array voltage implies that the array is acting as current source. It builds up the voltage until it’s able to force current through the load. If the load is open-circuited, VPV reaches the open-circuit rating of the array (63.6 V).
This behavior of the PV panels is used to push back the power coming from AC-DC converter. If the PV power increases, the PV voltage pushes back the power coming from the converter. Whenever there’s a reduction in PV power, more power is automatically drawn from the mains. Thus, the user will always get constant light output irrespective of fluctuations in the sunlight intensity.
At any given time, any available PV power is fully utilized to drive the SDL. Only balance power is drawn from the mains supply.
Solar lighting system design
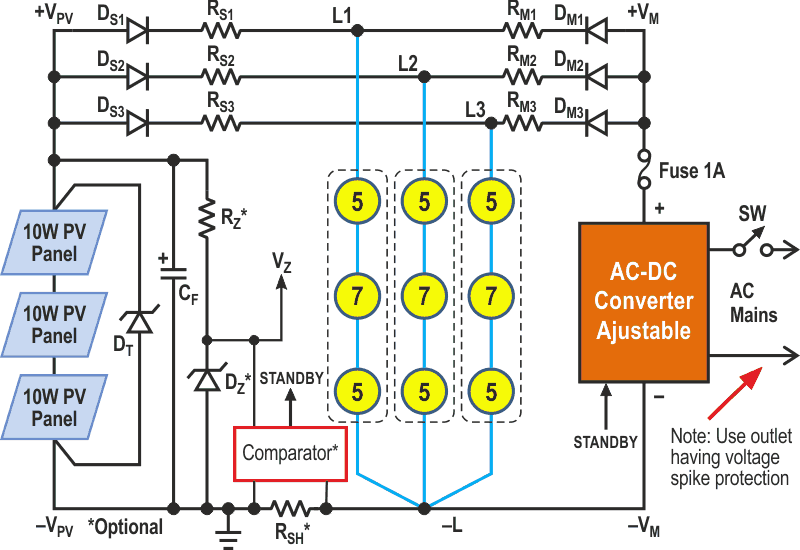
Figure 3 presents a circuit diagram of the proposed solar lighting system. It consists of three PV panels connected in series. The output of the PV array is connected to three LED lamps (L1, L2, and L3) through diodes DS1, DS2, and DS3 and resistors RS1, RS2, and RS3. LED lamps are also connected to the output of AC-DC converter VM through diodes DM1, DM2, and DM3 and resistors RM1, RM2, and RM3.
 |
|
| Figure 3. | The proposed solar lighting system circuit diagram supports the PV-pushback-effect. |
Design details of the circuit include:
- Solar PV array voltage at maximum power (VPVM): 17.5 × 3 = 52.5 V
- Forward voltage of 1 W white LED (VLED): 3 V; for 17 LEDs, it’s 51 V
- Number of LEDs connected in series: 52.5/3 = 17.5 (rounded to 17)
- LED current: 0.2 A (max LED current is 0.33 A)
- Number of LED lamps connected to the PV array: 0.58/0.2 = 2.9 (rounded to 3)
- Residual voltage: 52.5 – 51 = 1.5 V; wire resistance from panel to lamp = 0.6 Ω
- Resistance (RS) = (1.5 V – VD – VWIRE)/0.2 = (1.5 – 0.7 – 0.6 × 0.58)/ 0.2 = 2.2 Ω
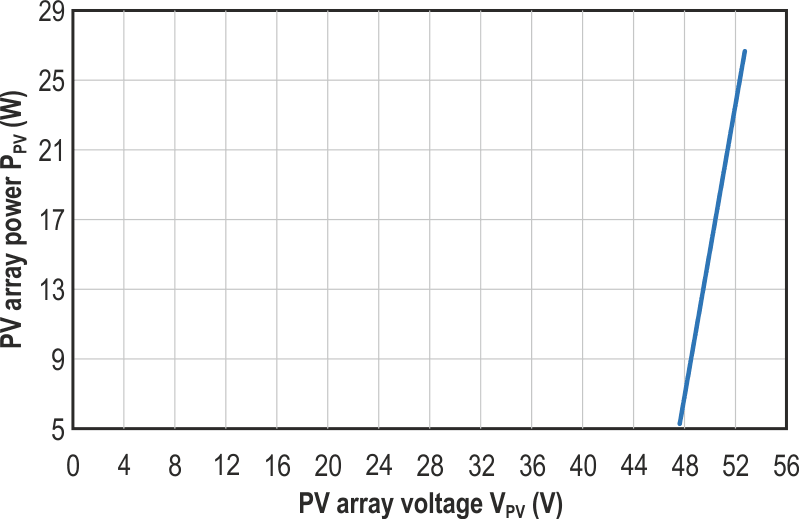
Figure 4 shows the plot of array power PPV vs. array voltage VPV. Looking at the plot, it’s very clear that this simple SDL does track the maximum power point very closely. Therefore, an SDL provides a good amount of light throughout the day on a sunny day. If this much light is sufficient, then the AC-DC converter could be manually turned OFF using switch SW.
 |
|
| Figure 4. | The plot shows the PV array power versus VPV voltage for the SDL with the converter OFF. |
Selecting the AC-DC converter
For lamp voltage of 51 V, a 48-V AC-DC converter is selected. This converter has provisions for adjusting the output voltage VM up to 53 V. The converter output is also connected to the lamps (L1, L2, and L3) through diodes DM1, DM2, and DM3 and resistors RM1, RM2, and RM3. These resistors help in increasing the source resistance of the converter.
With these resistors, we can enhance the pushback effect. The output voltage adjustment of the converter also helps in controlling the pushback effect. After a few trials, a 3.3-Ω resistor was selected for each lamp, and VM was set to 52 V. For safety purposes, a 1-A fuse is included in the converter output circuit.