Frank Cox, Linear Technology
Linear Technology Magazine
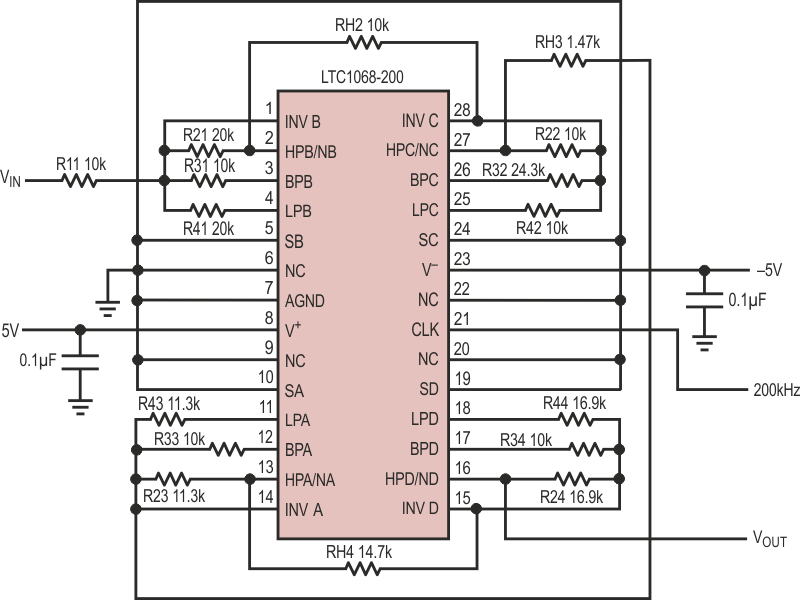
The circuit in Figure 1 is a 1 kHz 8th order Butterworth highpass filter built with the LTC1068-200, a switched capacitor filter (SCF) building block. In the past, commercially available switched capacitor filters have had limited use as highpass filters because of their sampled-data nature. Sampled-data systems generate spurious frequencies when the sampling clock of the filter and the input signal mix. These spurious frequencies can include sums and differences of the clock and the input, in addition to sums and differences of their harmonics. The input of the filter must be band limited to remove frequencies that will mix with the clock and end up in the passband of the filter. Unfortunately, the passband of a highpass filter extends upward in frequency by its very nature. If you have to band limit the input signal too much you will also limit the passband of the filter, and hence its usefulness.
 |
||
| Figure 1. | LTC1068-200 1 kHz 8th order Butterworth highpass filter. | |
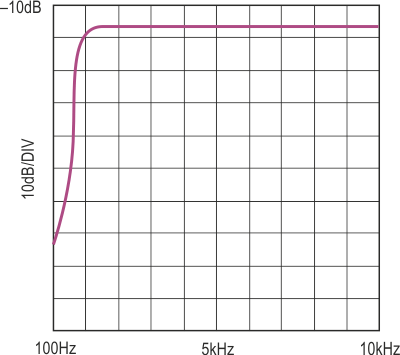
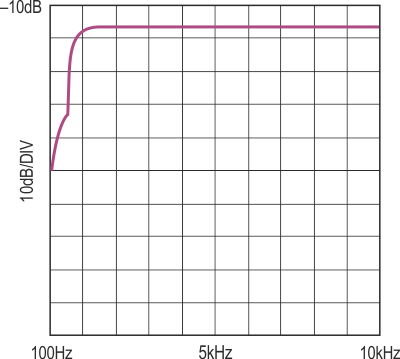
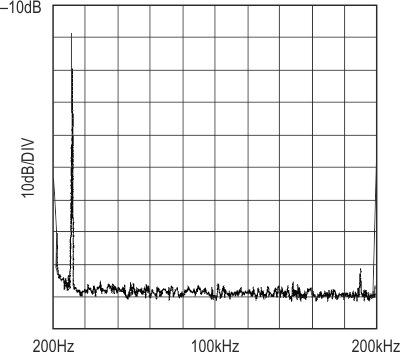
What makes this filter different is the 200:1 clock-to-center frequency ratio (CCFR) and the internal sampling scheme of the LTC1068-200. Figure 2a shows the amplitude response of the filter plotted against frequency from 100 Hz to 10 kHz. For comparison, Figure 2b shows the same filter built with an LTC1068-25. This is a 25:1 CCFR part. The 200:1 CCFR filter delivers almost 30 dB more ultimate attenuation in the stopband. A standard amplitude vs frequency plot of a highpass filter can be misleading because it masks some of the aforementioned spurious signals introduced into the passband. Figure 3a is a spectrum plot of the 200:1 filter with a single 10 kHz tone on the input. This plot shows that the spurious free dynamic range (SFDR) of the LTC1068 highpass filter is in excess of 70 dB.
|
||||||
| Figure 2. | а) Amplitude vs frequency response of Figure 1’s circuit. b) Amplitude vs frequency response of comparable filter using the LTC1068-25. |
|||||
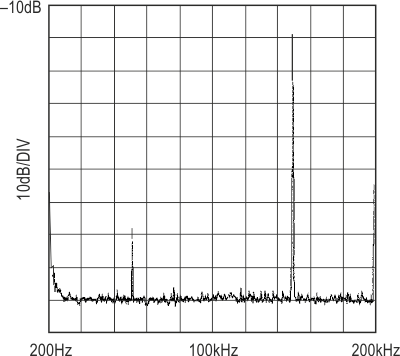
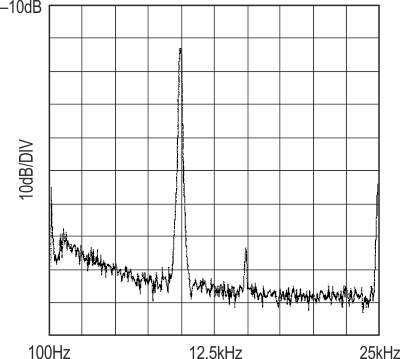
In fact, the filter has a 70 dB SFDR for all input signals up to 100 kHz. In a 200 kHz sampled-data system, you would normally need to band limit the input below 100 kHz, the Nyquist frequency. Because the LTC1068 uses double sampling techniques, its useful input frequency range extends to the Nyquist frequency and even above, albeit with some care. Figure 3b shows the LTC1068-200 highpass filter with an input frequency of 150 kHz. There is a spurious signal at 50 kHz, but even though there is no input filtering, the SFDR is still 60 dB. For input signals from 100 kHz to 150 kHz, the filter demonstrates an SFDR of at least 60 dB. The SFDR plot of the same filter built with the LTC1068-25 is shown in Figure 4. Note that the lower CCFR (25:1) part still manages a respectable 55 dB SFDR with a 10 kHz input. The LTC1068-25 is used primarily for band-limited applications, such as lowpass and bandpass filters.
|
||||||
| Figure 3. | а) Spectrum plot of Figure 1’s circuit with a single 10 kHz input. b) Spectrum plot of Figure 1’s circuit with a single 150 kHz input. |
|||||
 |
||
| Figure 4. | Spectrum plot of a comparable filter using the LTC1068-25 with a single 10 kHz input shows a respectable 55 dB SFDR. |
|
Note:
The filters for this article were designed using Linear Technology’s FilterCAD™ (version 2.0) for Windows®. This program made the design and optimization of these filters fast and easy.
