A maximum power point tracking (MPPT) controller circuit is extremely useful in solar photovoltaic systems for boosting power usage efficiency. The traditional MPPT design, though, requires the use of a multiplier to calculate power from source voltage and current measurements. However, it’s possible to build an MPPT controller without this multiplication stage by measuring power on the load rather than using source parameters.
If we aren’t in the presence of a strange exotic load, current generally grows with voltage and we obtain maximum power from a source when the output voltage (or current) is at its maximum. In the case of a resistive load, this simply means:

Because we are smart at designing buck converters, we may assume that the power on the load in a photovoltaic system is equal to the power provided by the solar panel. Thus, getting the maximum voltage (or current) at the output also means getting the maximum power transfer.
 |
||
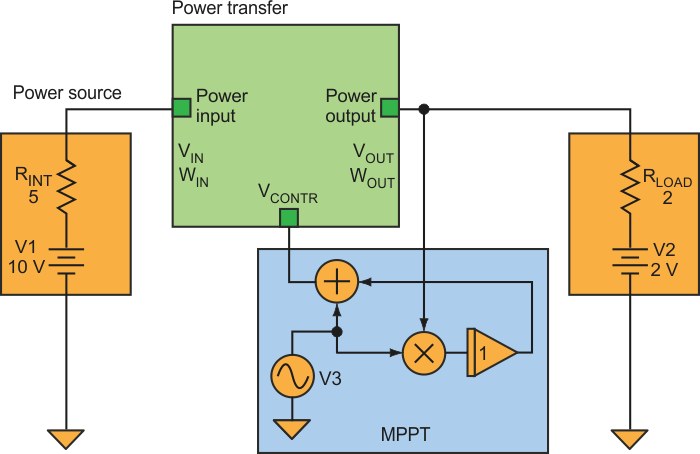
| Figure 1. | By using load voltage measurements rather than source parameters, this MPPT controller avoids the need for a multiplier to calculate power. |
|
I didn’t build a prototype for this idea, but I checked it by changing some firmware on a power supply we have under development. The model (Fig. 1) simulates the power source as a dc generator with an internal resistor and the power transfer block as an ideal buck converter where:
WIN = WOUT
and
VOUT = VIN × VCONTR
where 0 ≤ VCONTR ≤ 1.
The signal VCONTR comes from the MPPT circuit, which is an extremely simple “perturb-and-observe” type. A perturbation signal from oscillator V3 and the power transfer block’s output voltage feed a synchronous detector. The output of that detector adds to the perturbation signal to generate VCONTR, seeking to maximize the output voltage of the power transfer block.
 |
||
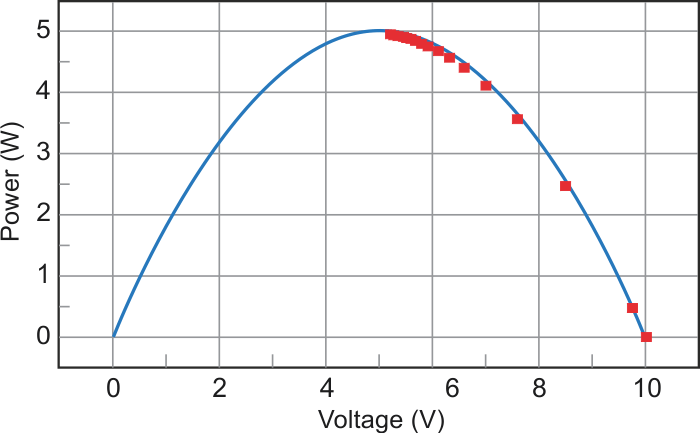
| Figure 2. | The simulation model shows that the MPPT correctly drives the output power (red squares) up the source’s power output curve to the maximum. |
|
The model reveals the transfer block’s behavior when we operate the MPPT (Fig. 2). The continuous trace is the output voltage versus power diagram of a 10-V source with a 5-W series resistance. The red squares are equally time-spaced samples of the transfer block’s output, showing that this simplified MPPT controller successfully “climbs” the power hill to achieve maximum power transfer.
