David Williams
EDN
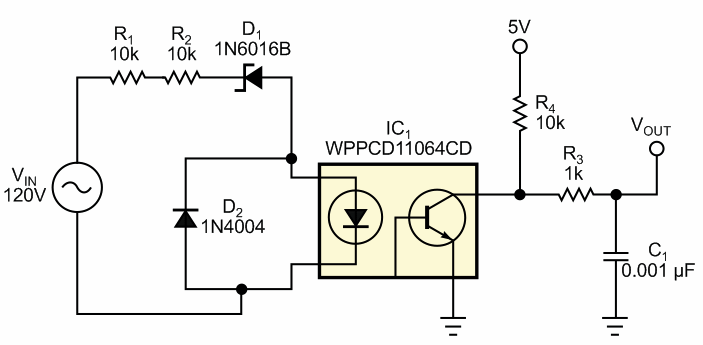
The circuit in Figure 1 provides a low-cost, isolated ac-line monitor that measures ac-line-voltage level and has some other unique capabilities. The analysis of the circuit is straightforward: When the ac input, VIN, is positive relative to neutral, you apply it to the network comprising R1, R2, D1, and the LED in optocoupler IC1. Current flows in this network when the voltage is high enough to get zener diode D1 and the diode in the optocoupler to conduct. This diode pair’s conducting voltage is the enable voltage, VE. The zener diode’s reverse-breakdown voltage of 47 V and the optocoupler’s LED forward voltage of 1.2 V make the enable voltage 48.2 V. Any voltage below this level drives the output of the optocoupler high. When the voltage exceeds the enable voltage, the transistor in the optocoupler becomes saturated, pulling the output low. The output continues to stay low until the input voltage drops below the enable voltage.
 |
|
| Figure 1. | This simple ac-mains voltage monitor’s output is a square wave whose width is proportional to the input-voltage level. |
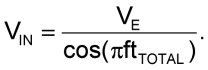
The resulting output is a square wave with a fixed time, tTOTAL, based on how long the input voltage is above the enable voltage. If the voltage on the input varies from 120 to 144 V, the resulting square-wave waveform becomes wider; if the voltage varies downward, the pulse width decreases. To calculate the formula for this circuit, consider the input waveform as a cosine function. Because the input voltage peaks at time zero, the optocoupler circuit is on, and the output voltage is low. It continues to be low until the input voltage moves below the enable voltage. The following equation yields the time when this crossover happens:
![]()
Because the cosine function is symmetrical around zero, time tON is half the total time that the output pulse is high. Because a microprocessor’s timer port usually captures the time, the simplest way to calculate the input voltage from the pulse width is to replace the on-time with the total time and then to solve the equation for the input voltage, which gives the result as a function of the measured pulse-width output from the optocoupler:
You can implement this formula in software or a look-up table that converts pulse width to input voltage. Take note that the input voltage is the peak ac voltage, so you must convert it to the rms value if necessary. You can also use this circuit as a clock line because the output frequency is independent of the duty cycle. The output is consistently 60 Hz, and you can use it for timekeeping. You can also potentially use it for zero-crossing-load driving if you extrapolate the time back to the zero crossing based on the input voltage, because the duty-cycle edge time-shifts from the real zero crossing.
Some other design principles in this circuit require attention. D2 protects the diode in the optocoupler when the ac input goes negative. In most cases, the optocoupler diode is unaffected because the reverse leakage through the network ensures that the LED does not exceed its maximum reverse voltage. However, bypassing the diode is the best approach for clamping the voltage across this optocoupler using a diode. Adding this diode does more than double the quiescent current in the circuit, and, because you apply this current to the ac line, it may be a concern for both energy consumption and power dissipation in the resistors in the input circuit.
If you need a more accurate estimation of input voltage, some options improve circuit function. The main source of this variation is the 5% tolerance on the zener voltage. A 5% variation on this voltage can result in a significant error in your estimate of the input-voltage amplitude. Specifying a more precise diode or calibrating each board by applying a known input voltage and storing that value in memory as a fixed calibration improve the overall accuracy of this circuit.