Arash Ushani
EDN
As a professional engineer, I'm often overworked and stressed. When I need a break I sometimes sit at my desk and play with waves. I enjoy creating and viewing signals in different forms, signals of all shapes and sizes. It's become almost a passion which during stressful times, reminds me of the magic of waves.
Despite jaw-dropping computer graphic technologies, creating Lissajous patterns and other images on a oscilloscope is still exciting. Many online pages explain them in detail and show several popular patterns. Practically every engineer who has worked with an oscilloscope has, at some point, seen these patterns. Technical journals including EDN publish creative techniques to produce interesting Lissajous patterns from time to time. A Lissajous pattern, which is essentially the display of voltage and frequency relationships between two signals has been depicted in old science fiction movies to represent "super" technology.
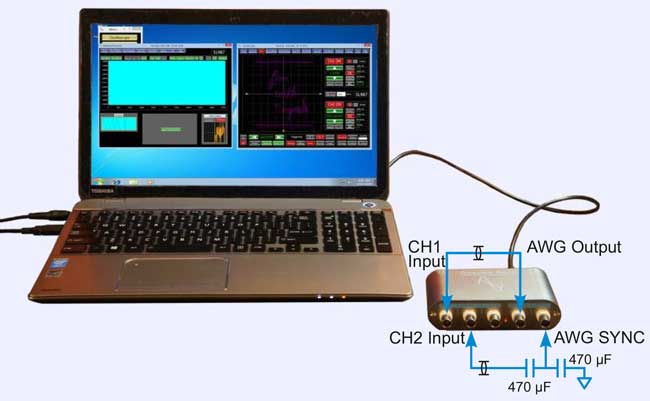
To produce these patterns, you need two signal sources and a two-channel oscilloscope with the XY capability. In this article I used an Analog Arts SL987, an oscilloscope with a built-in arbitrary waveform generator; you can use an oscilloscope and waveform generator of your choosing. Figure 1 shows how output of the waveform generator connects to the oscilloscope's CH1 (or the "X") input. The generator's SYNC output is first bypassed to GND with a 470 µF capacitor to reduce its rise and fall times. Then, the signal is AC-Coupled by another 470 µF capacitor and then through a coax cable to the oscilloscope's CH2 (or the "Y") input. This creates a rough synchronized triangle wave to use as a vertical sweep.
 |
|
| Figure 1. | Connecting two channels of a waveform generator lets you create a Lissajous pattern. |
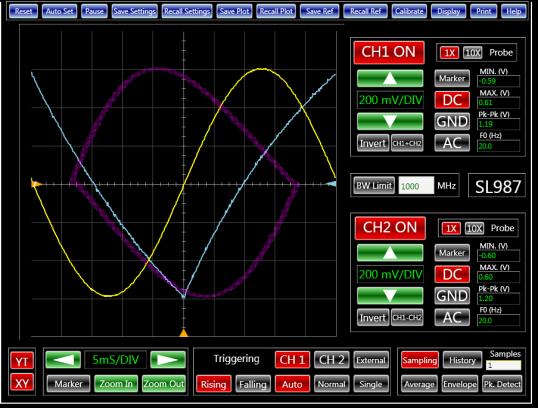
The capacitors at the generator's SYNC output distort the square-wave signal. For an output frequency of about 20 Hz, the distorted SYNC signal is a pseudo triangle wave with a peak-to-peak amplitude of 1.2 V. Figure 2 shows the "X" signal in Yellow, the "Y" signal in blue, and the resultant Lissajous pattern in pink.
 |
|
| Figure 2. | By setting an oscilloscope's channels as X and Y inputs, you can create a Lissajous pattern. |
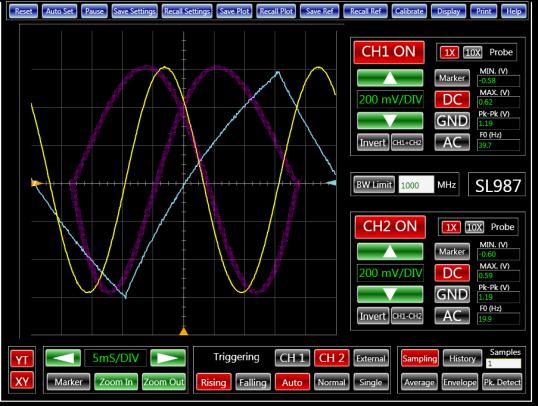
By switching the generator to its arbitrary mode of operation, you can create more creative patterns. For example, generating a 2 cycle sine wave in a memory span of 64 kbytes with a sampling rate of 1.3 MHz produces the pattern shown in Figure 3.
 |
|
| Figure 3. | Here's a more interesting Lissajous pattern. |
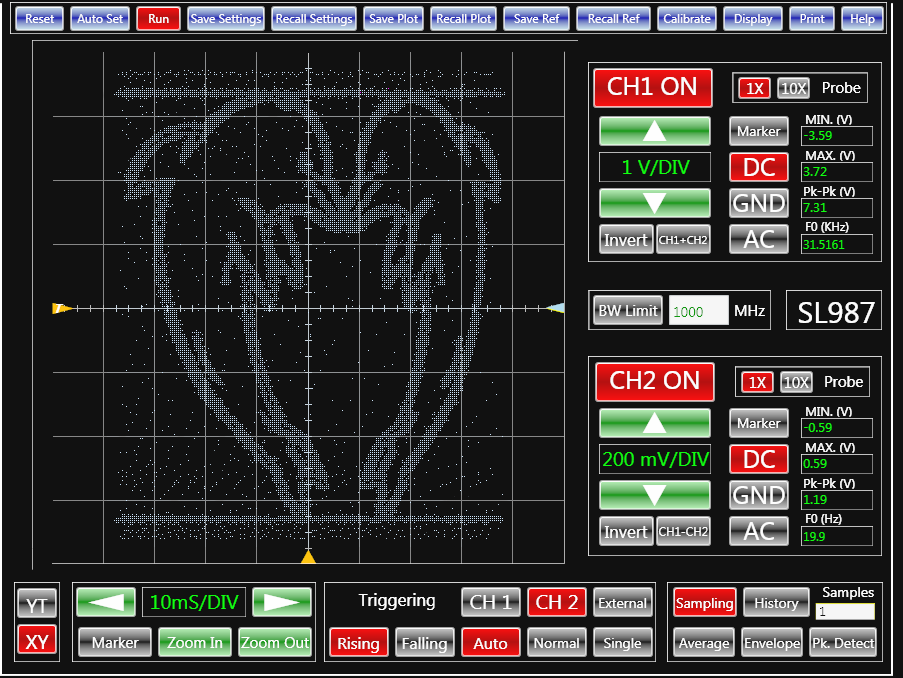
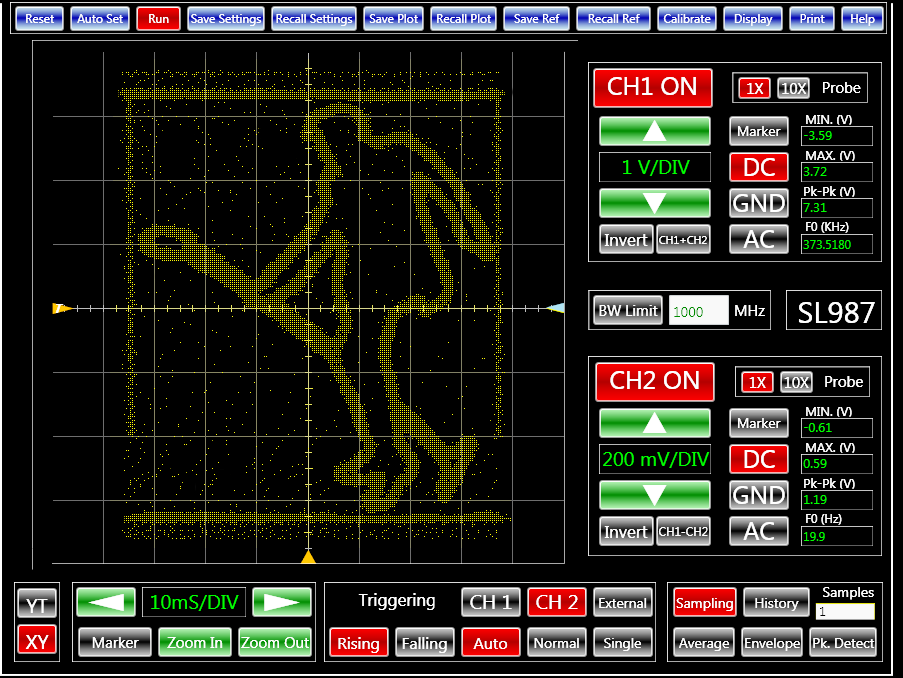
Lissajous curves are great, but what if you could draw a face, or some other arbitrary image, on an oscilloscope? By providing the appropriate "X" and "Y" signals, you can create any pattern. In fact, this is exactly how old cathode ray tube TVs worked. To produce an image on the oscilloscope screen, for a pseudo triangle signal on the "Y" input, the "X" input can be computed based on the image's digital information. The tricky part is now how to generate the appropriate arbitrary signal to draw the desired image. At any given time, the vertical sweep specifies where in the image we are currently drawing. For example, assume that our vertical sweep ranges from –1 V to +1 V. When it's at –1 V, the CH1 or "X" signal should be drawing the bottom of the image. When it is at 0 V, the CH1 or "X" signal should be drawing the center row of the image. Because we know that the vertical sweep is synchronized to the arbitrary function generator, at any given sample in the arbitrary waveform, we can predict exactly where the vertical sweep will be. In this manner, we can create our arbitrary waveform. This is similar to how some video formats work.
At times, the arbitrary signal needs to be both –1 V and +1 V at the same time. What can you do then? You can tackle this by quickly cycling through the different voltages you require. The signal can stay at –1 V for a short period of time, and then quickly jump to +1 V and stay there for a short period of time, and repeat. You will, however, need to make sure that your arbitrary function generator has a fast rise time and the oscilloscope has a sufficiently high bandwidth.
 |
|
| Figure 4. | Dolphins on an oscilloscope? Who knew? |
You can take any black and white image (i.e., a pixel map of where to draw and where not to draw with your signal.) I've written a simple python application that does this and converts a given image to a waveform, saved in a csv file that you can load into a function generator. This arbitrary waveform itself looks like gibberish. But, when viewed in XY mode with the vertical sweep, the original images appear. Figures 4 and 5 show the results.
 |
|
| Figure 5. | What would Elvis say if he saw himself on an oscilloscope? |
Generally, images with sharp edges such as cartoons produce sharper plots. In these plots "snowy" effects are the result of the generator's output filter limiting the bandwidth. In an ideal situation, you need infinite bandwidth both for the generator and the oscilloscope to eliminate the effect. Also, improving the digital-signal-processing algorithm will enhance the quality of the plots. Nevertheless, seeing the images on the oscilloscope screen are indeed enjoyable. I encourage you to try this out yourself. But be warned: it can be a lot of fun and somewhat addictive. There's nothing quite like using state-of-the-art technology to draw the face of your favorite EDN editor, see the video below.
Downloads
Demonstration video