Overview
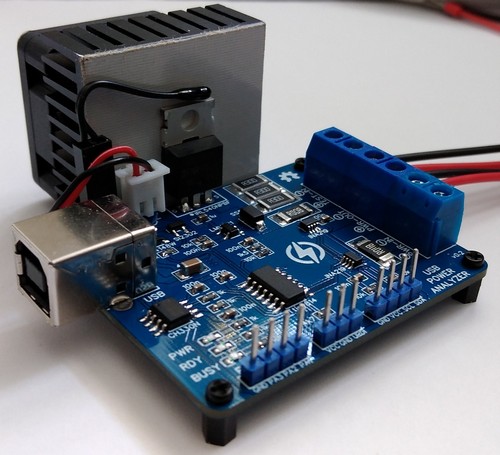
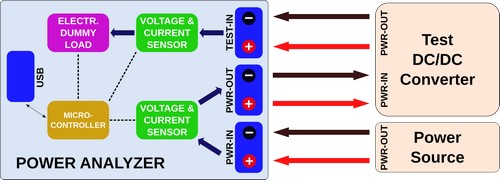
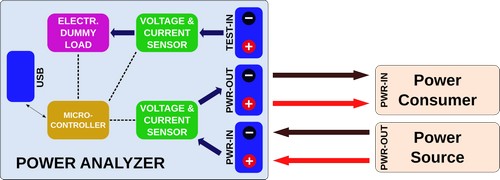
The Power Analyzer is a programmable electronic constant current dummy load with two high side voltage and current sensors for an automatic analysis of power supplys, DC/DC converters, voltage regulators, batteries, chargers, power consumers and others (Figure 1). The device can be controlled via USB serial interface using a serial monitor or the provided Python skripts. Data can be exported to spread sheet programs or directly be analyzed by the Python skript.
 |
||
| Figure 1. | Power Analyzer is a programmable electronic constant current dummy load for an automatic analysis of power supplys. |
|
Working Principle
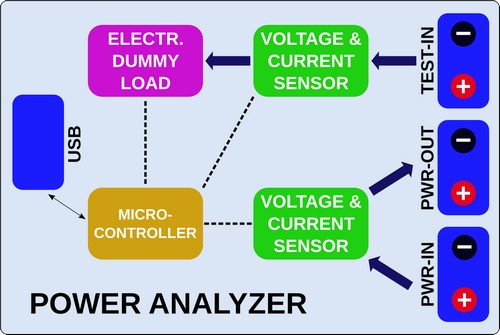
Block Diagram is shown in Figure 2.
The ATtiny814 controls the electronic dummy load with its internal digital to analog converter (DAC). All of its 5 internal reference voltages are being used in order to get the maximum accuracy and resolution of the DAC. The DAC is connected to an OpAmp LMV321 which acts as a unity gain amplifier controlling the resistance of the MOSFET IRL540NPBF. Voltage and current are measured via a high side 8 mOhm shunt resistor connected to an INA219 with a resolution of 4 mV/1 mA. A second INA219 is connected to another 8 mOhm shunt resistor between the PWR-IN and PWR-OUT terminal (Figure 3). The Power Analyzer is connected via USB to a PC or a RaspberryPi. Commands to the Analyzer can be sent via a serial monitor or by the GUI-based Python skript. The Analyzer has different built-in automatic test algorithms. The collected data is sent back via the serial interface/USB to the PC/RaspberryPi. The ATtiny814 constantly measures power and temperature of the heatsink. It controls the fan and cuts off the load when the temperature gets too hot.
Project files are available in download section and in EasyEDA [1]. Arduino sketch and Python application available on download section and github project page [2]
 |
||
| Figure 2. | Power Analyzer on Attiny814 Block Diagram. | |
 |
||
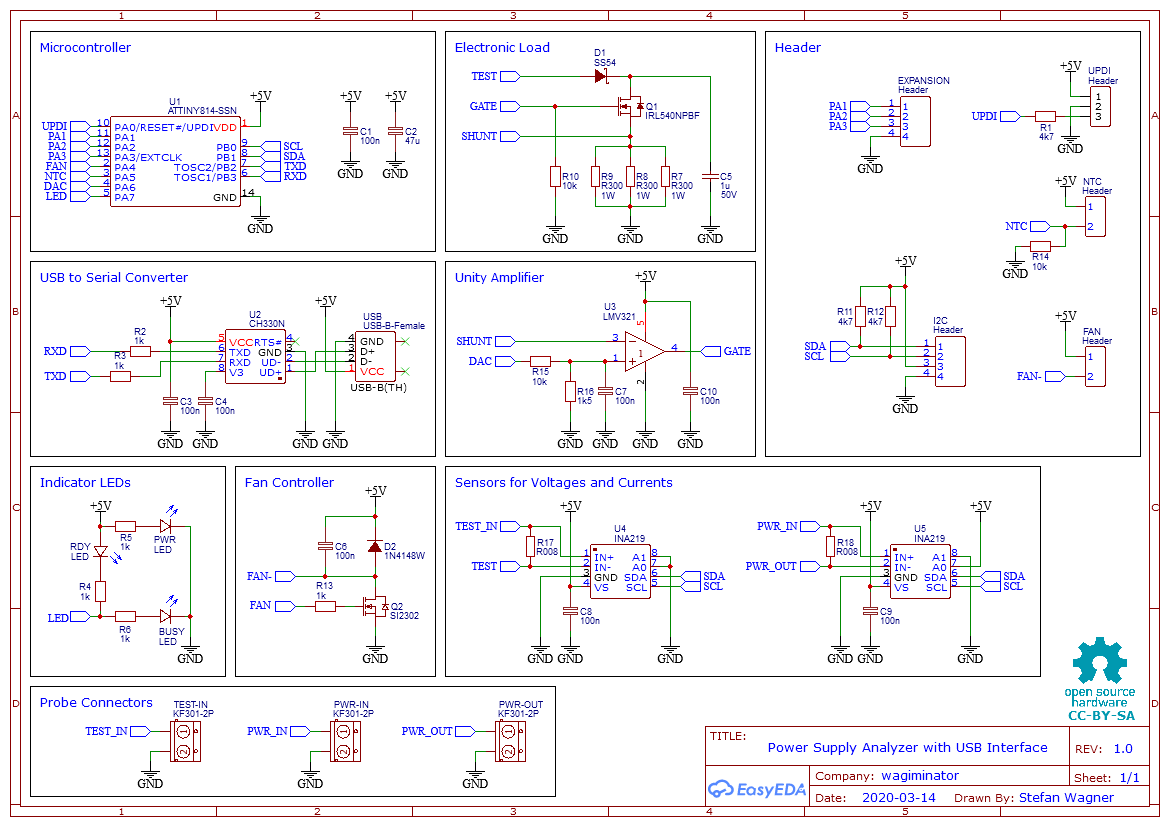
| Figure 3. | Power Analyzer Schematic Diagram. | |
Test Algorithms
- Using a serial monitor: Test algorithms can be started by sending the corresponding command via a serial monitor. The collected data will be displayed in the serial monitor and can be exported to a spread sheet program for further analysis.
- Using the GUI-based python application: This is the easy way. Everything should be self-explanatory. All following example pictures are created by this application.
Load Test
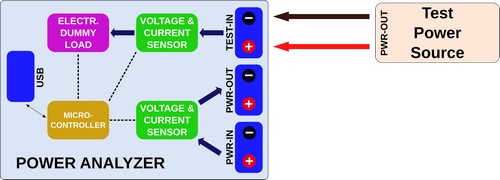
Block Diagram for Load Test is shown in Figure 4.
 |
||
| Figure 4. | Power Analyzer for Load Test Block Diagram. | |
Command:
l maxloadcurrent[mA: 17..5000] minloadvoltage[mV: 0..26000]
Example: "l 2500 4200"
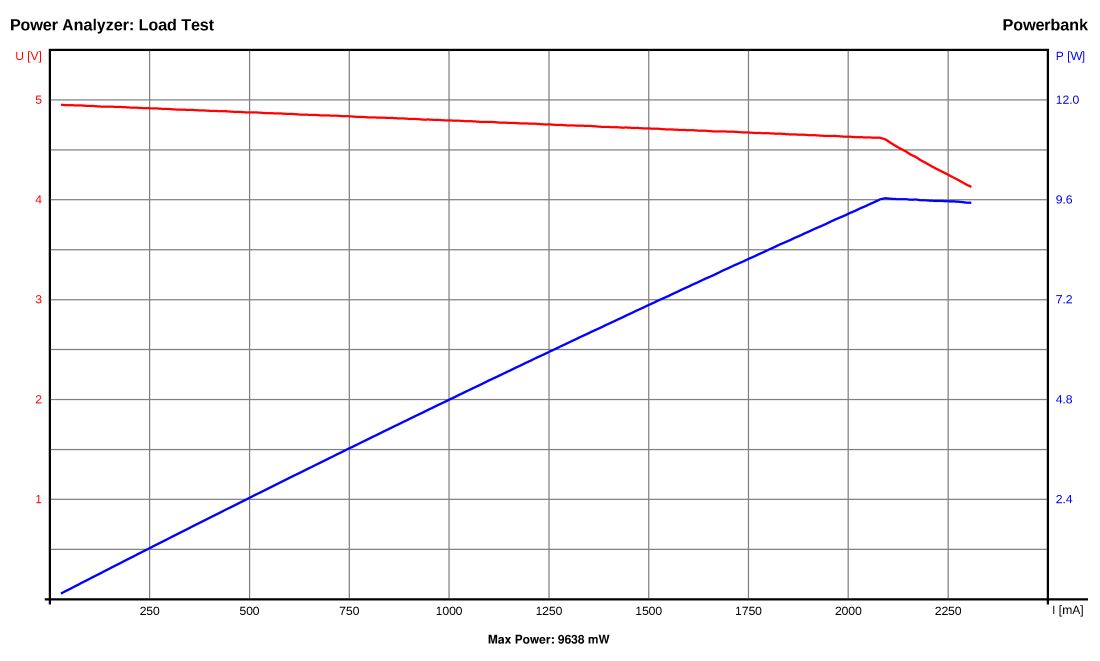
The Power Analyzer continuously increases the load from 17 mA up to maxloadcurrent. It stops automatically if the voltage drops below minloadvoltage. It continuously transmits the measured values via the serial interface in the format: current[mA] voltage[mV] power[mW] (seperated by the SEPERATOR string). Example for Power Analyzer Load test is shown in Figure 5.
 |
||
| Figure 5. | Power Analyzer: Powerbank Load Test example. | |
Voltage Regulation Test
Block Diagram for Voltage Regulation Test is shown in Figure 6.
|
||
| Figure 6. | Power Analyzer: Block Diagram for Voltage Regulation Test. | |
Command:
g maxloadcurrent[mA: 17..5000]
Example: "g 3000"
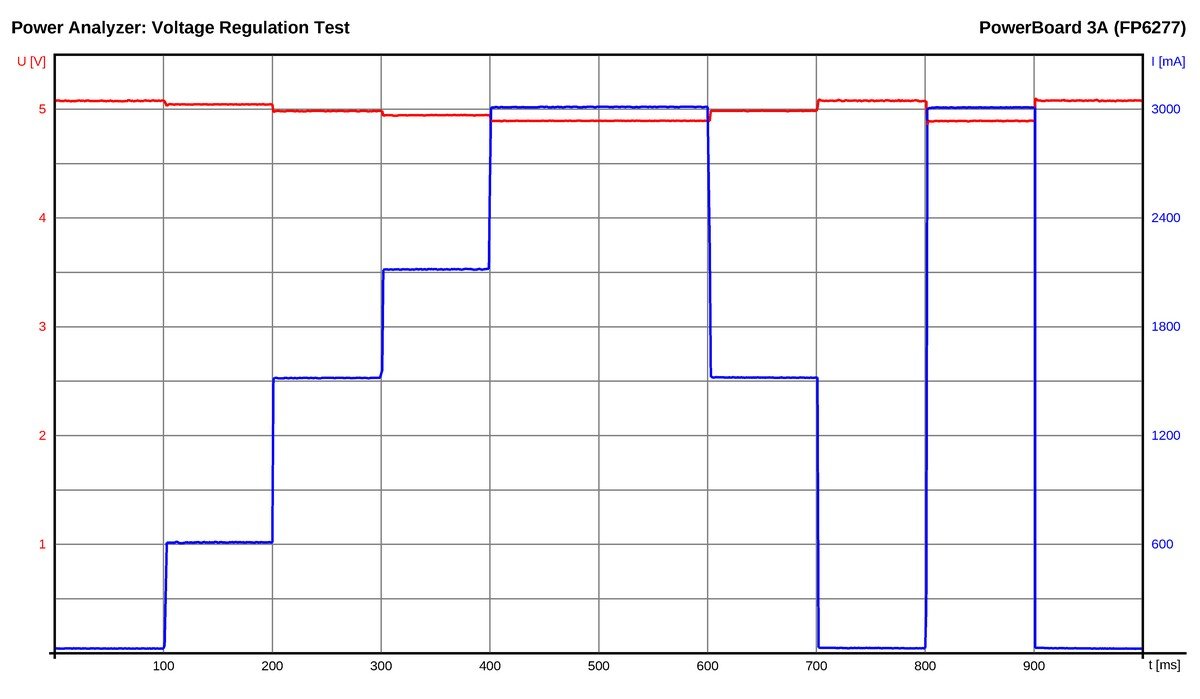
The Power Analyzer changes rapidly the load between 17 mA and maxloadcurrent. It continuously transmits the measured values via the serial interface in the format: time[ms] current[mA] voltage[mV] (seperated by the SEPERATOR string). Example test for 3A Power Board on FP6277 is shown on Figure 7.
 |
||
| Figure 7. | Power Analyzer: Example test for 3A Power Board on FP6277. | |
Efficiency Test
Block Diagram for ВС/ВС converter Efficiency test is shown on Figure 8.
 |
||
| Figure 8. | Power Analyzer: Block Diagram for DC/DC converter Efficiency test. | |
Command:
e maxloadcurrent[mA: 17..5000] minloadvoltage[mV: 0..26000]
Example: "e 4000 2500"
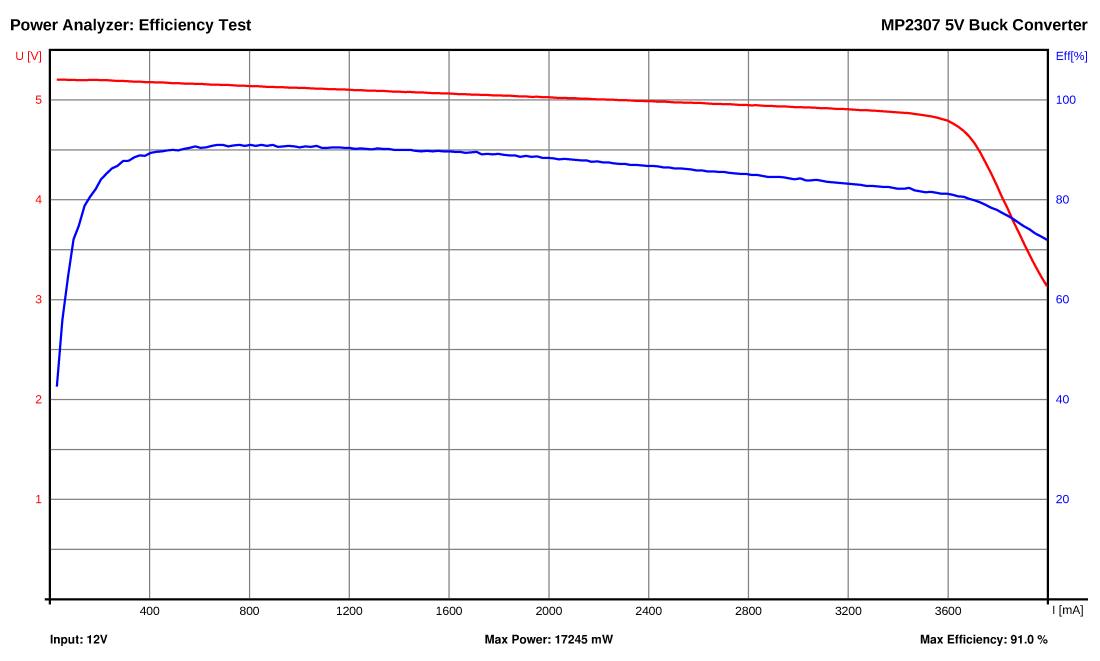
The Power Analyzer continuously increases the load from 17 mA up to maxloadcurrent. It stops automatically if the voltage at TEST-IN drops below minloadvoltage. It continuously transmits the measured values via the serial interface in the format: current[mA] voltage[mV] efficiency[% * 10] (seperated by the SEPERATOR string). DC/DC converter on MP2307 Example test result is shown on Figure 9.
 |
||
| Figure 9. | Power Analyzer: DC/DC converter on MP2307 Example test result. | |
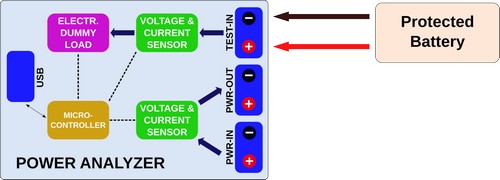
Battery Discharge Test
Power Analyzer for battery discharge test Block Diagram shown on Figure 10.
 |
||
| Figure 10. | Power Analyzer: Battery Discharge test Block diagram. | |
Command:
b maxloadcurrent[mA: 17..5000] minloadvoltage[mV: 0..26000]
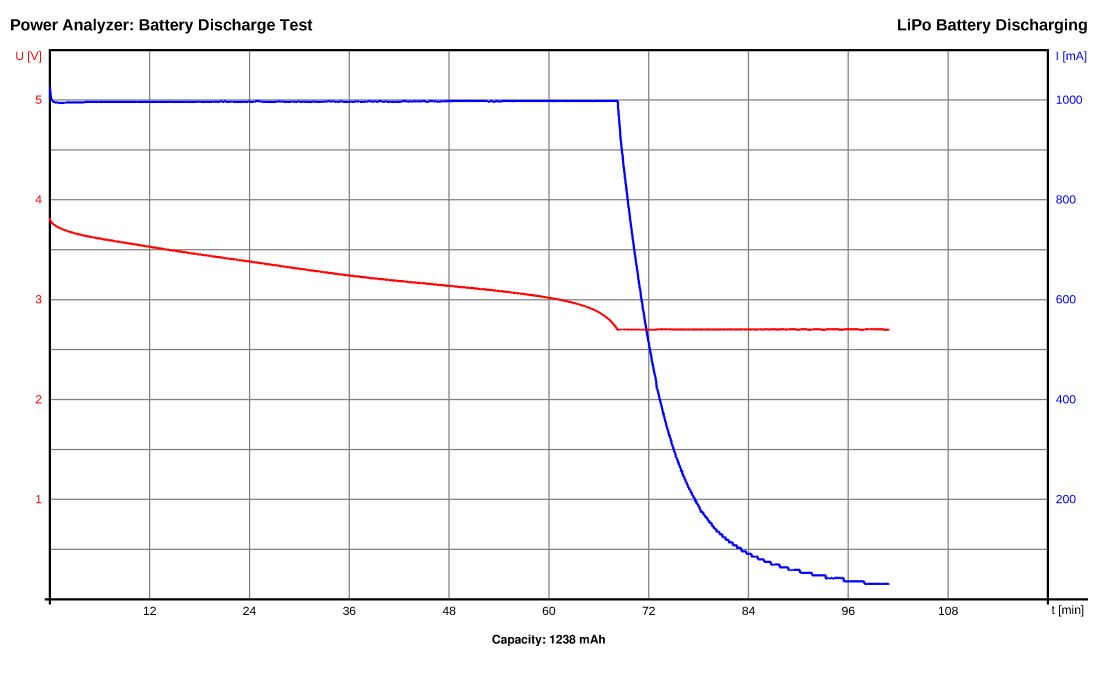
Example: "b 1000 2700"
The Power Analyzer sets a constant current load of maxloadcurrent. If the voltage drops below minloadvoltage it constantly decreases the load to maintain minloadvoltage. It stops automatically if the load current drops to 0 mA. It continuously transmits the measured values via the serial interface in the format: time[s] current[mA] voltage[mV] capacity[mAh] (seperated by the SEPERATOR string).
 |
||
| Figure 11. | Power Analyzer: Li-Po battery discharge test example | |
Long-Term Multimeter
Long-Terrm Multimeter based on Power analyzer is shown on Figure 12.
 |
||
| Figure 12. | Power Analyzer: Long-Term Mulimeter Block Diagram. | |
Command:
m interval[ms: 2..65535] duration[s: 1..65535]
Example: "m 18000 18000"
The Power Analyzer measures voltage, current and power delivered to the test device at every interval for a total of duration. It continuously transmits the measured values via the serial interface in the format: time[ms] current[mA] voltage[mV] (seperated by the SEPERATOR string). Lon-Term Multimeter for measure Li-Ion charger based on TP4056 example is shown on Figure 13.
|
||
| Figure 13. | Power Analyzer: Long-Term Multimeter measuring Lo-Ion charging. | |
Commands for Direct Control
| Command | Function |
|---|---|
| "i" | transmits indentification string ("Power Analyzer") |
| "v" | transmits firmware version number |
| "x" | terminate current test program |
| "s loadcurrent[mA]" | set load to a constant current of loadcurrent |
| "r" | reset the load to minimum |
| "t" | read current and voltage of both sensors and transmit them |
Demonstration video
Notes
- Use a good heatsink with a 5 V fan for the MOSFET! Attach a 10 K 3950B NTC thermistor to the heatsink close to the MOSFET!
- Be careful with high power loads! Make some tests to figure out what can be achieved with your cooling solution!
- Due to the limitations of the cheap OpAmp the minimum load current is around 17 mA. You can choose a better OpAmp if you like (must have same pinout, must be rail-to-rail and unity gain stable), but for most cases this is not necessary.
- The maximum load current is 5 A, however for small voltages it might be less.
- The maximum PWR-IN/PWR-OUT current is 8 A.
- Do not exceed the maximum voltage of 26 V on all connectors !
- In order to make the design much simpler all connectors including USB share a common ground. Keep this in mind when making your test setup in order to avoid ground loops or shorts. Using a USB isolator between the Analyzer and your PC is not a bad idea!
- Windows users may need to install a driver: http://www.wch.cn/download/CH341SER_ZIP.html. This is not necessary for linux users.
- You need a UPDI programmer for uploading the firmware. You can find one in my projects [3] or you can use an Arduino as a jtag2updi. Further information can be found at [4].
- The Python skript was only tested on Linux, but it should also work on other operating systems.
- The software is still in development. There might be some minor bugs. New functions and test algorithms will be added in the future.
References
- Schematic and PCB in EasyEDA
- Project page on github.com
- UPDI programmer
- Attiny microcontrollers in Arduino IDE