Igor Lovrić
Few months ago, I got request to find some kind of solution to measure G-Forces in moving car. I found a lot of commercial products on net, but in my country it is little bit difficult to buy them, so I decided to make my own software and hardware. For hardware, I choice PIC16F877 that I had spare in my drawer, PIC firmware was written in MikroC, and software was written in Delphi 7.
You can download full schematic, code for PIC, HEX file, demo files and PC software from download section.
First problem was how to choice proper sensor for measuring G-Force. I was looking all over the net for sensors (you can find many models on Digi-Key, with analog outputs, digital outputs, 2 axes, 3 axes, more or less sensitive etc. and most of those are just fine for PIC projects), and I found on Mikro Elektronika site just the right thing for my project. It was Three-Axis Accelerometer Board with ADXL330 sensor produced by Analog Devices. It has 3 axis measurement from -3G to +3G, and analog outputs 0-5V. Additionally, from Mikro Elektronika web site you can download very nice code samples in MikroC, Mikro Pascal and Mikro Basic, and full documentation on how to use this board in your project. And the best thing about it, it has very fair price!
After I ordered this board, I had one week to wait for postman to bring me my board. Just enough time to make hardware, firmware and PC software. First things first, it was a time to start designing schematic for hardware part. As you can see, schematic is very simple, one 16F877, one MAX232 for serial communication, and few passive components. Later on, I adder LED, and speaker for signalizing that device is connected/disconnected from PC. One note here: At first for testing purposes I used laboratory power supply, and 78L05 for additional stabilization. Later I put 9V battery instead of power supply, and you can't imagine difference in noise on output of accelerometer board. When I put battery, I got beautiful smooth graphics on my screen :). So, one more thing, as you can see on schematic, instead of using 3 wires for serial communication (RX, TX and GND), I use two additional lines (CTS and RTS). I use those two lines just to check from PC software if device is disconnected from PC. Yes, I know, I could use software control, but I just like to do it this way :) On the left side of PIC you can see ZTT resonator 4MHz. If you don't have this component, just build your own oscillator for pic.
|
|
|
| G-Force Monitor. |
And now, little bit of talk about firmware. I actually took sample from Mikro Elektronika for using accelerometer board and made few changes. As you can see from code, communication protocol is very simple, it just send hi and lo byte of int that it reads from analog inputs. I added some code for CTS/RTS on port B, sound playing, and storing settings in EPROM. I'll talk about those settings later. Calibration function in firmware is leftover from testing. I do calibration from PC software, but I leave it here just for testing in future.
Next step was to do some programming, and make PC software. As I already said, I wrote it in Delphi 7, I use Delphi for years, so this was logical choice. I won't write here about coding of software, it is not to much interesting for you, I'll write a little bit about how to use software.
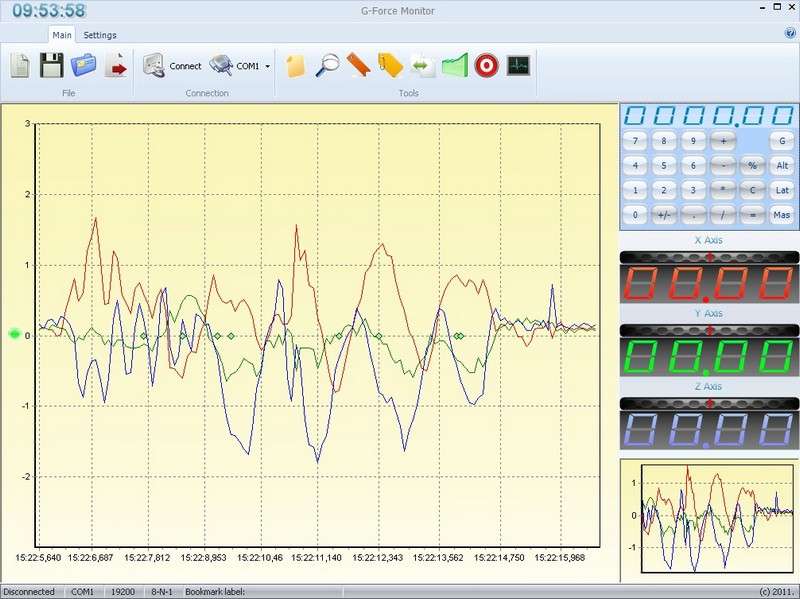
First thing you'll see on screen is that there are two graphics. Bigger one is full time recording, and small one shows last 100 samples. Also you can see calculator (nothing special, just calculator, user asked for it) and 3 displays that shows readings in real time.
Buttons are pretty much self explanatory, but here we go, from left to right, New file, Save file, Open file. Next button is Export, this is tricky one :) You can export all data in CSV or TXT format, but you'll first have to choice format on settings page. Also, when you click export, you can choice units for data export. It can be Acceleration in G units, Acceleration in m/s2 or force in N. I'll talk little bit later about those units. Now lets continue with buttons, next two buttons are for connecting to device. When you turn on device, you'll hear beeping sound, this is signal that there is no connection. Connect it to com port, choice com port from drop down list, and click connect. In few moments you'll hear connection sound from device, on bottom of screen you'll see Connected message, and graphic with collected data would be visible.
Other buttons:
- Show Log - When you click on this button, you'll get window with raw data sent from device.
- Auto Zoom - When this button is turned on, Y axis of chart will be automatically zoomed so data values would fill whole height.
- Bookmark - Add bookmark - Shortcut key: B or `. After you add bookmark, you can zoom in that part by double clicking on it. Also, you can hide bookmarks by clicking on little green circle on the left side of X axis.
- Set Bookmark Labels - You'll get new window where you can set labels for bookmarks.
- Swap Charts - You can swap small and big chart. Nice option if you want to see just last 100 samples on full screen
- Threshold - After you finished collecting data, if there is too much noise you can filter it with this option. You can filter all axes together, or separately, also you can adjust level of noise attenuation. After you apply those filters, you'll see red TH sign in top left corner. Warning: You can't undo threshold, so if you need original data, please save it first.
- Move Zero Point - With this option you can set zero point for X, Y and Z axis. It is useful if you want to see separate graphs, so you can move graphs up or down. Also, if your device is not perfectly leveled, you'll se that one graph is little bit higher or lover. You can adjust it with this option, or you can click on Avarage button, so software would try to set zero point for you.
- Screen shot - Noting special, just making screenshot of graphic.
Now we'll see what we have on settings page.
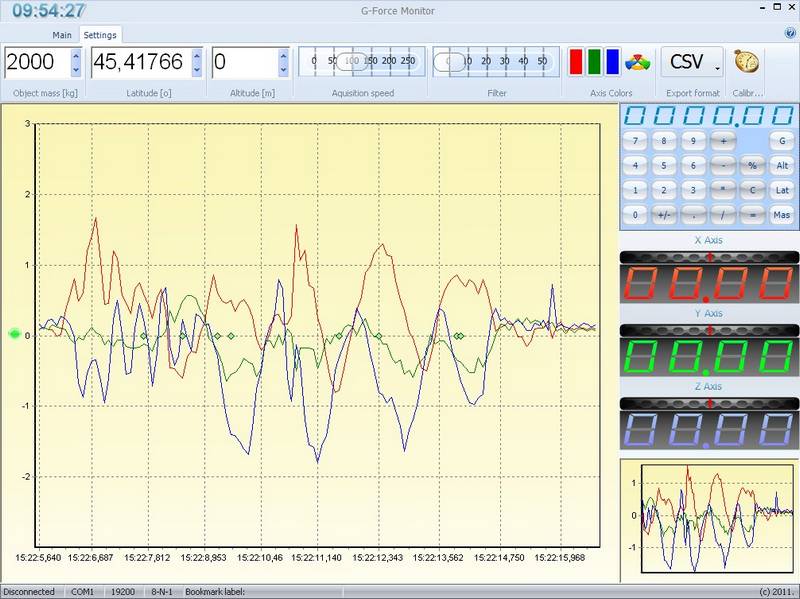
You can see that you can adjust Object mass. This is important only for exporting data in N units. So you should put here mass of moving object that device is attached to. As you probably know F = m × a, so this is why we need that.
Next two options, Latitude and Altitude, are important also for exporting. Maybe you know, maybe you don't, but acceleration of earth gravity field depends on latitude and altitude, so you can set those things here, so when you export data, you'll get proper values.
After that, you can see two sliders, first one is for adjusting acquisition speed, and other one is real time noise filter. It is not so good as threshold filter, but if you need filter in real time while acquiring data, this is option for you. When you set those parameters, they'll be written i device EPROM, so when you reconnect device, or restart software, they'll be still there.
I won't explain those color buttons, they are here just to change X, Y and Z graph colors.
I already wrote about next option, it is drop down menu where you can choice export file type.
And last option, but one that made me scream while programming it..... Calibration!!!. It was little bit difficult for me to set up everything, and adjust for the first time, but this is procedure for calibration (you'll need bubble leveling tool, or some other tool so you can put device in 0 degrees, and 90 degrees position):
- Turn on device and connect it with software
- Put X and Z axis of device in horizontal position, and Y axis to go down vertical
- Adjust graph with Set Zero G X, Set Zero G Z and Set One G Y that way so X and Z graphs are on zero G line, and Y graph is on 1G line.
- Put Y and Z axis of device in horizontal position, and X axis to go down vertical
- Adjust graph with Set Zero G Y, and Set One G X that way so Y graph is on zero G line, and X graph is on 1G line.
- Put X and Y axis of device in horizontal position, and Z axis to go down vertical
- Adjust graph with Set One G Z that way so Z graph is on 1G line.
So, what you actually did, you set 0G, and 1G values for all axes. It is very important thing to do with every new device you make. Those settings are not stored in device, they are in INI file that you can find in folder where you installed G-Force Monitor application.
Yes, and one more important thing, calibration options are password protected, i did this because I didn't wan't to have phone call from user after he destroy calibration data. Password is: 13wesa32Sa - With capital S after 32.
Downloads