John Caldwell, Texas Instruments
EDN
Introduction
Multilayer ceramic capacitors (MLCCs) are used extensively in modern electronics because they offer high volumetric efficiencies and low equivalent series resistances at attractive prices. These advantages make MLCCs nearly ideal for a wide range of applications, including output capacitors for power supplies and local decoupling capacitors for integrated circuits. The various types of MLCCs are delineated primarily by their temperature coefficient, which is the amount of variation in their capacitance over a specified temperature range. Class I types, given a designation of NP0 or C0G, must vary less than ±30 ppm over their operating temperature range, while Class II types can change anywhere from ±15 percent (X7R) to +22 percent /–82 percent (Z5V).
The temperature coefficient of an MLCC is a direct effect of the materials used in the ceramic that forms the capacitor dielectric. Furthermore, the dielectric material also determines the electrical characteristics of the capacitor. Class II dielectric types (X7R, Z5U, Z5V), often are referred to as “high-k” ceramics because their dielectric materials, have relative permittivities that range from 3000 (X7R) up to 18000 (Z5U). Class I C0G capacitors tend to have relative permittivities in the range of six to 200. The benefit of increased relative permittivity of the dielectric material is that high-k MLCCs are available in much larger capacitance values and smaller packages than C0G types.
Unfortunately, these advantages come with a downside: high-K MLCCs exhibit a substantial voltage coefficient, meaning their capacitance varies depending on the applied voltage. In AC applications this phenomenon manifests itself as waveform distortion and can compromise the overall system performance. When printed circuit board (PCB) area and cost are major design constraints, board and system level designers may be tempted to use high-K MLCCs in circuits where they can introduce significant distortion into the signal path.
Demonstrating high-K MLCC distortion
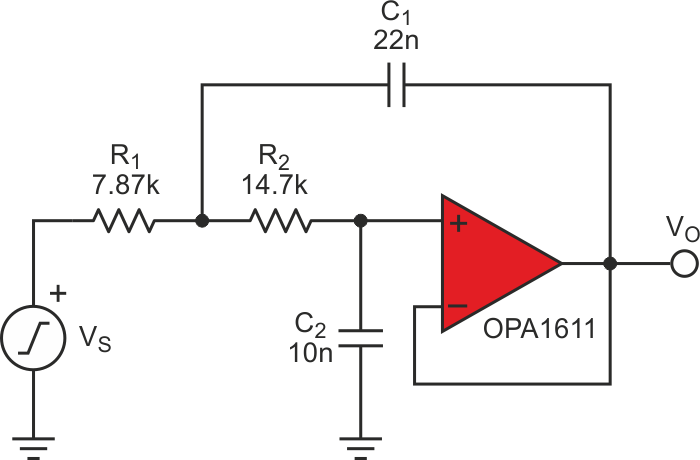
Active filter circuits, anti-aliasing filters for data converters, and feedback capacitors in amplifiers are examples of circuits where the use of a high-K MLCC may introduce distortion. In order to illustrate this effect, a 1 kHz Butterworth active low-pass filter using the Sallen-Key topology was designed using TI’s FilterPro software. Active filters are a very common application where distortion from capacitors degrades the overall circuit performance. Many designers choose low resistor values in an effort to reduce their contribution to the output noise and this increases the value of capacitors required for a certain corner frequency. Because of this design decision, high-k MLCCs may be the only capacitors available that meet the requirements for capacitance, board area, and cost.
The filter circuit shown in Figure 1 incorporates passive component values, which allow capacitors C1 and C2 to be replaced with MLCCs of varying dielectric types and package sizes, allowing the direct comparison of measurements between different capacitor types. All of the capacitors used in this testing had voltage ratings of 50 V.
 |
||
| Figure 1. | A Sallen-Key low-pass filter with a corner frequency of 1 kHz. | |
For this example, the OPA1611, a high-performance audio operational amplifier (op amp), was chosen as a low noise and low distortion foundation for the circuit. Thin film precision resistors in 1206 packages are used for all resistances in order to minimize distortion contributions aside from those arising from the capacitors. According to The Design of Active Crossovers, some resistor types are capable of producing distortion similar to capacitors [1]. Finally, the circuit was powered from ±18 V supplies to prevent the possibility of amplifier saturation affecting the measurements.
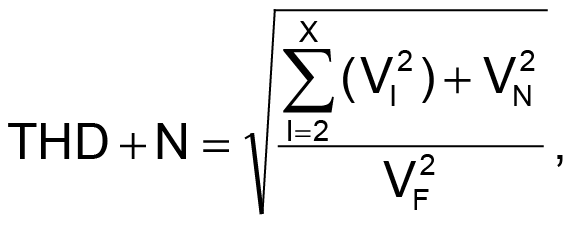
Total harmonic distortion and noise (THD+N) is a figure of merit that seeks to quantify the amount of unwanted content added to a signal by a circuit’s noise and non-linearity. This quantity can be expressed as a ratio of the harmonics and system RMS noise voltage to the RMS voltage of the fundamental. Harmonics, or signals at frequencies that are integer multiples of the input signal, arise from non-linear behavior of passive components and integrated circuits. The total noise of a circuit is the result of the intrinsic noise of integrated circuits, the thermal noise of resistors, or it could be coupled into a circuit by external sources. Equation 1 shows the calculation for THD+N as an amplitude ratio where VF is the RMS voltage of the fundamental, VN is the RMS noise voltage, and VI is the RMS voltage of each harmonic.
 |
(1) |
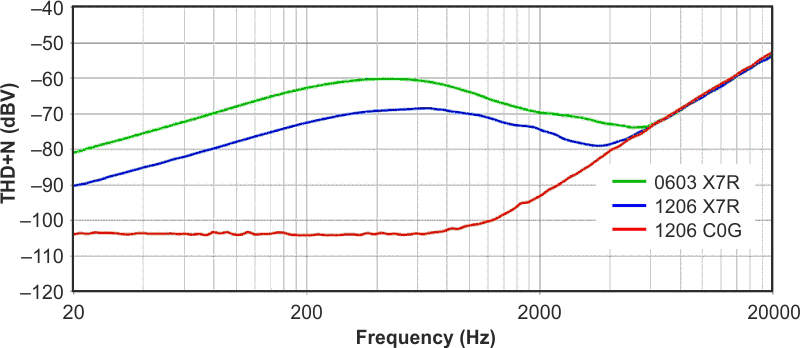
THD+N measurements were made on the filter circuit for a 1 Vrms signal over the frequency range of 20 Hz to 20 kHz with a measurement bandwidth of 500 kHz. Figure 2 shows the measured THD+N performance of the circuit in dB relative to 1 Vrms for different capacitor types. MLCCs of the C0G dielectric type in 1206 packages deliver exceptional performance: the measured THD+N in the filter’s pass-band is at the noise floor of the measurement system. C0G capacitors in 0805 packages were also tested and provide the exact same level of performance, and were removed from the graphs for simplicity. The increase in THD+N above the filter’s corner frequency is expected as the filter’s attenuation decreases the ratio of the signal’s amplitude to the noise floor.
 |
||
| Figure 2. | Measured THD+N of the Sallen-Key low-pass filter. | |
By changing the capacitors to X7R types in 1206 packages, an immediate degradation of the circuit’s performance is observed. The THD+N was increased by a minimum of 15 dB at 20 Hz, and peaks in the region between 400 and 800 Hz where a 35 dB increase in THD+N is measured. Moving to X7R capacitors in smaller 0603 packages further increases THD+N by an additional 10 dB over much of the spectrum. Because the op amp and resistors in the filter are unchanged across all tests, the increased THD+N numbers must be the result of additional harmonics produced by the X7R capacitors in the circuit’s output signal.
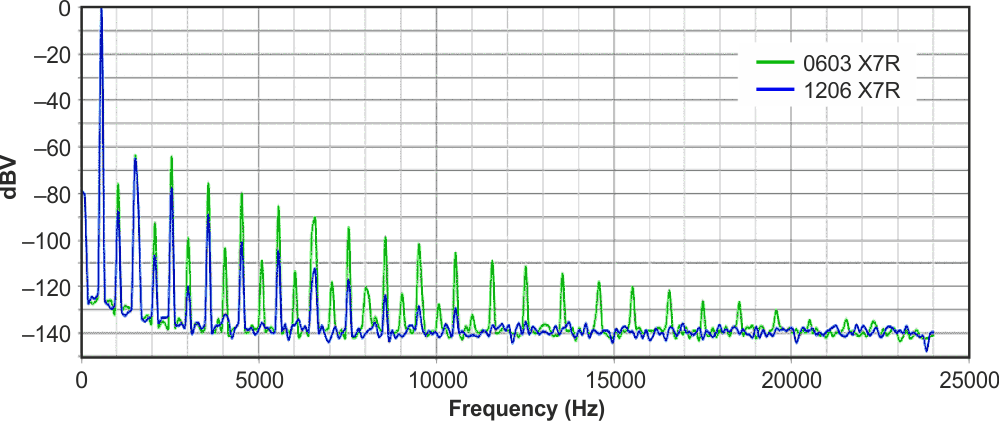
Figure 3 shows the spectrum of a 500 Hz sine wave taken at the filter’s output when 0603 and 1206 X7R capacitors are used. The spectrum shows a large number of fundamental harmonics, with odd order harmonics being dominant. It may be surprising that when the circuit is constructed with 0603 X7R capacitors, harmonics above 20 kHz are observed for a 500 Hz input signal.
 |
||
| Figure 3. | Spectrum of a 500 Hz sine wave taken at the output of the low-pass filter circuit Identifying the distortion source. |
|
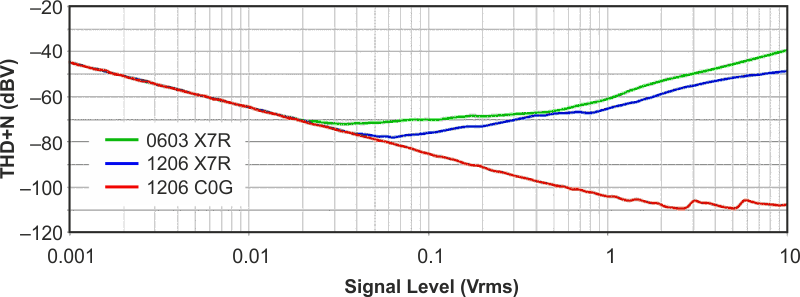
Faced with the task of tracking down the source of high levels of distortion, it may not be immediately intuitive to an engineer whether an integrated circuit or passive components are at fault. One method to determine the dominant source of distortion is to measure the circuit’s THD+N over a wide range of signal levels (Figure 4). In Figure 1 the THD+N of the Sallen-Key filter is displayed for a 500 Hz fundamental with a signal level from 1 mVrms to 10 Vrms. When the circuit was constructed with C0G capacitors, the THD+N decreased for increasing signal levels, eventually reaching the noise floor of the measurement system at a 2 Vrms signal level.
 |
||
| Figure 4. | Filter circuit’s THD+N for increasing signal level (500 Hz fundamental). | |
The line’s negative slope indicates that the circuit noise, due to the op amp and resistors, is the dominant factor in the THD+N calculation. In this case, the measured THD+N decreases with increasing signal levels because the signal voltage ratio to the noise voltage is improved. Conversely, non-linearities in passive components are exacerbated at higher signal levels and should cause a rising trend in distortion for increasing signal levels. This is confirmed when the capacitors in the filter circuit are replaced with those of the X7R type. X7R capacitors in 0603 packages show rising distortion beginning at signal amplitudes of 20 mVrms. X7R capacitors in 1206 packages exhibited similar behavior with the rising trend in distortion beginning at 40 mVrms. Thus, if a circuit exhibits a rising trend in distortion with increasing signal levels, passive component (resistors or capacitors) are most likely the dominant limitation of the circuit’s performance.
 |
||
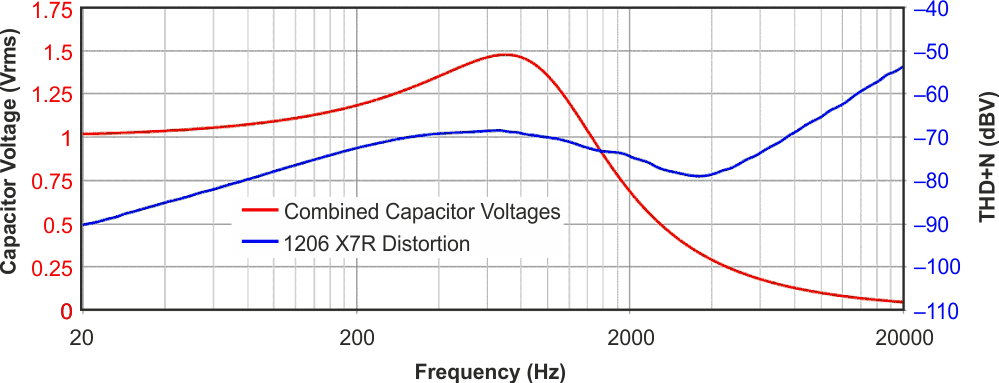
| Figure 5. | The combined capacitor voltages and measured THD+N of the low-pass filter circuit. | |
Because passive component distortion increases with higher signal levels, it follows that filter circuit distortion should be greatest when the capacitors experience maximum applied voltage. The AC transfer characteristic analysis in Texas Instruments’ free SPICE simulator, Tina-TI™, can be used to plot the voltage across components in a circuit as a function of frequency. Figure 5 shows the combined voltages across capacitors C1 and C2 over the frequency range from 20 Hz to 20 kHz, as well as the filter’s THD+N for X7R capacitors in 1206 packages. The individual voltages across capacitors C1 and C2 are combined using a root sum of squares method and is at a maximum at approximately 600 Hz. Figure 5 illustrates that this peak in capacitor voltage strongly correlates to the maximum point of distortion and is a very good indicator that the capacitors are the source of excess distortion in the filter’s output. Some misalignment between the two measurements may be present, if the two capacitors generate unequal amounts of distortion. This analysis can be furthered by determining the signal gain from each capacitor.
Conclusion
The performance of an analog circuit can be dramatically affected by the type of capacitors used in its construction. An active filter was used to demonstrate this principle. When the circuit was constructed with C0G capacitors, it delivered a high level of performance. However, once the capacitors were changed to those of the X7R dielectric type, the circuit’s performance was degraded considerably. X7R capacitors introduced a large number of harmonics into the signal path, with odd harmonics being the dominate contributors to the THD+N measurement. Specifically, X7R capacitors in 0603 packages exhibited the worst performance, and X7R capacitors in 1206 packages provided only marginally improved performance.
The two techniques described can help engineers determine the source of distortion in a circuit. First, measuring the THD+N over a wide range of signal levels is a useful method in determining whether a circuit’s performance is limited by an integrated circuit or by the linearity of the passive components. The distortion contributed by the non-linearity of passive components should exhibit a rising trend with increasing signal level. Second, TINA-TI can be used to identify which passive components are the source of distortion by correlating the frequencies of maximum distortion to the frequencies where these components experience the maximum applied voltage. Although there are many applications where the benefits high-k MLCCs are useful for engineers, it is not advisable to use them in areas of a system’s signal path where significant voltage drop across the capacitor allows it to contribute distortion.