Analog circuits have had their day; everything is digital now. However, here’s a simple analog circuit built with one good, old, but still available pulse-width-modulating regulator chip. The automatic DC heater controller circuit introduced here can be used to control DC heater coils, thermoelectric cooler chips, etc. Furthermore, the design can be used as the basis for countless experiments. Have fun!
 |
|
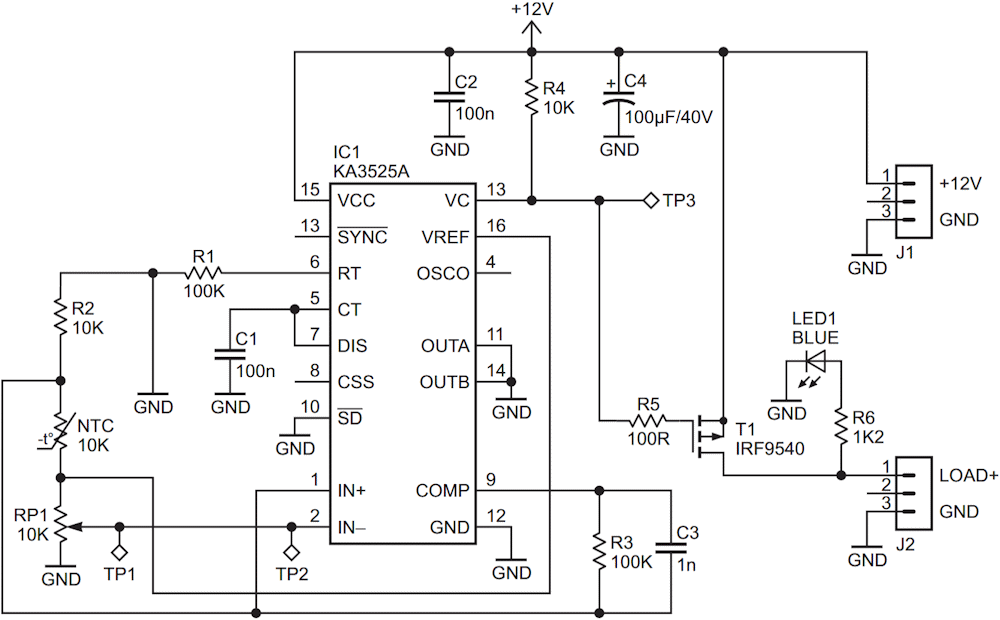
| Figure 1. | Schematic diagram of the PWM automatic heater controller. |
The core element of the circuit in Figure 1 is an SG3525A (KA3525A) pulse-width-modulator chip (IC1). The next key component is a negative temperature coefficient (NTC) thermistor that works as the temperature sensor. The powerful P-channel MOSFET IRF9540 (T1) at the output of the circuit can smoothly drive connected heater loads with current requirements up to 19 A at a 12-Vdc supply. Although not very crucial, a regulated/clean 12-Vdc input is recommended for this circuit. Table 1 shows the bill of materials.
| Table 1. | Component list | ||||||||||||||||||||||||
|
|||||||||||||||||||||||||
In the circuit, oscillator frequency follows the formula
FOSC = 1/CT(0.7xRT);
i.e.,
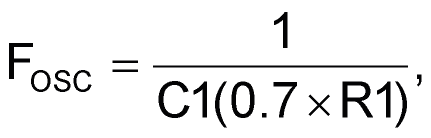
while the 10K trimpot (RP1) sets the duty cycle. Driver outputs of IC1 are grounded so that its VC terminal is switched to ground by the internal totem-pole source transistors on alternate oscillator cycles to drive T1. The NTC thermistor, together with the 10K resistor (R2), forms a potential divider to feed a proportional input to the inverting terminal (Pin 1) of IC1. Note that the internal 5.1-V reference of IC1 (Pin 16) is used to bias this potential divider and the trimpot connected to the non-inverting terminal (Pin 2). The R-C network (R3-C3) provides feedback compensation enough to prevent nasty overshoots and oscillations.
As all parts are not SMT (surface-mount technology) types, soldering and assembling will not be too difficult. After assembling the circuit on a perf board, it is time to calibrate the system. Once the initial calibration is correct, the circuit is ready to be worked with a real-world DC heater installation. Four things need to be set up to make the sketch work with an external heater load:
- Power up the circuit without an output load, and measure voltage at TP2 with the thermistor at environment temperature.
- Turn the trimpot RP1 to set the voltage at TP1 slightly higher than the observed voltage at TP2.
- Ensure that the blue indicator (LED1) lights up. Next, heat the thermistor by a lighted candle or heated soldering iron. Next, check that the blue indicator gradually diminishes and finally goes off.
- Remove the heat source and wait a moment to see if the blue indicator wakes up again.
Note that when you connect a heater across the output load connector J2, LED1 may not work because of the low-resistance path introduced by the heater coil. The indicator is, in fact, added as a visual aid helpful for occasional debugging!
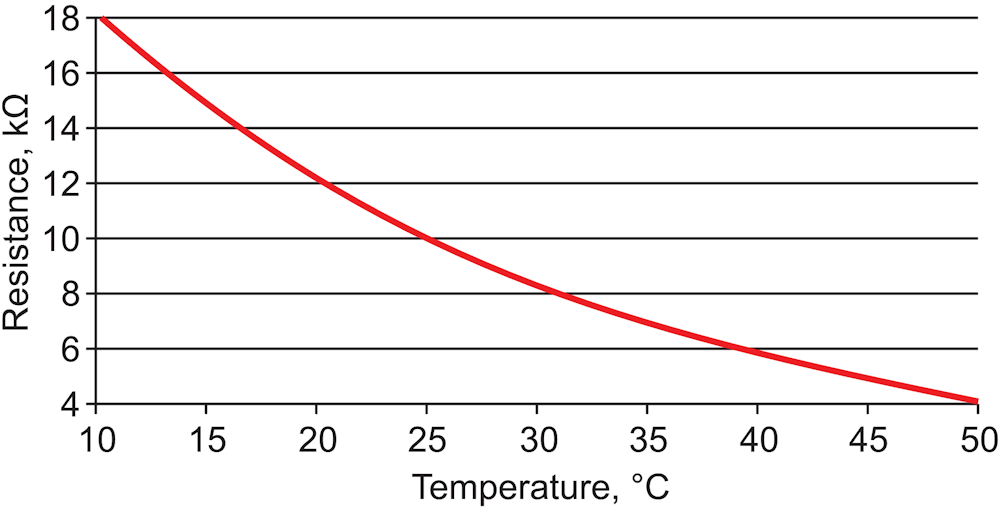
If you want to optimize your heating system, you first must record requisite parameters continuously and precisely. Once you have this data, you can quickly assess the impact of even relatively minor changes. Better understanding of the thermistor’s electrical characteristics also ensures a smooth takeoff in this regard (see Figure 2).
 |
|
| Figure 2. | Typical NTC thermistor characteristics (10 kΩ @ 25 °C). |
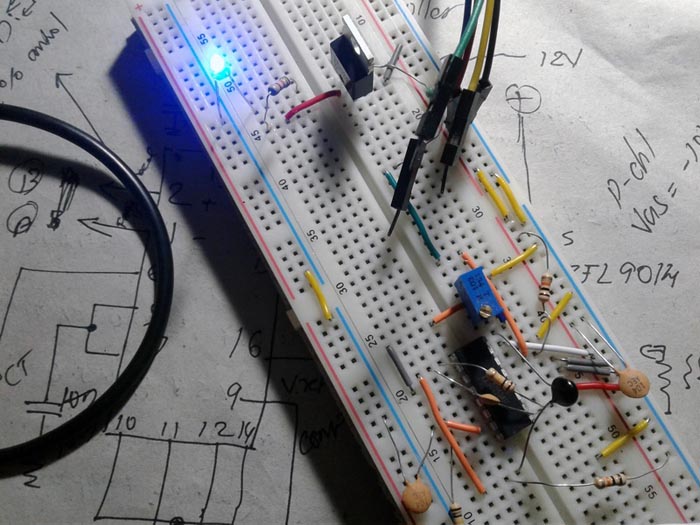
The author tested his breadboarded prototype of the design thoroughly to see whether the practical results matched the theory (see Figure 3) and got the final results as expected.
 |
|
| Figure 3. | A breadboarded prototype of the PWM automatic heater controller. |
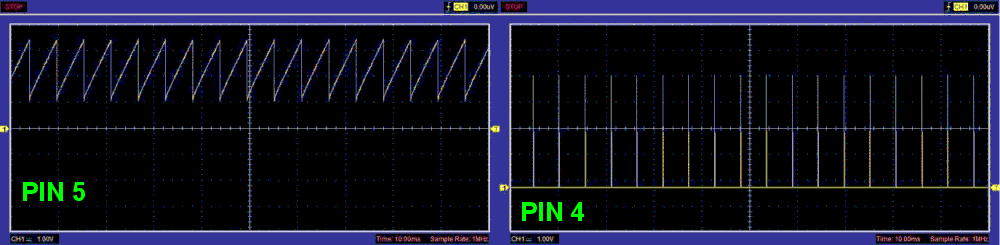
A bit of (boring) theory: The PWM frequency is determined by the R-C components R1 and C1 connected to Pin 6 (RT) and Pin 5 (CT) of IC1. You can monitor the frequency through Pin 4 of IC1. Shown in Figure 4 are two random oscillograms captured when the scope probed at Pin 5 and Pin 4 of IC1.
 |
|
| Figure 4. | Signals waveforms at Pins 5 and 4 of the IC1. |
Pin 1 and Pin 2 of IC1 are the inputs of onboard error amplifier to increase or decrease the duty cycle based on the voltage levels on them. When voltage on Pin 1 is greater than the voltage on Pin 2, duty cycle decreases, and vice versa. If duty cycle is at maximum, output at Pin 13 of IC1 is around 0.6 V, and it’s around 11.4 V (VCC-0.6) if the duty cycle is minimum. The “throttle” control works between these two margins and perpetually adjusts the PWM until the error is zero.
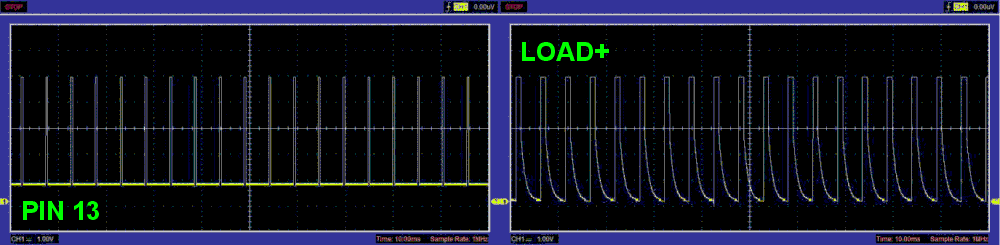
Pin 13 (VC) is, in fact, the supply voltage (4.5–35 V) terminal of the driver stage. Here, VC is used to drive the power MOSFET (single-ended supply mode of the chip) through a 100-Ω protection resistor (R5). Also see the next (again random) oscillograms in Figure 5: scope probed at Pin 13 (TP3) of IC1 and Load+ terminal of J2.
 |
|
| Figure 5. | Signals waveforms at Pin 13 (TP3) of IC1 and Load+ terminal of J2. |
Most of the high-precision temperature control system uses a microcontroller as the brain and digital temperature sensor chips for temperature sampling. This little DIY project is an analog art with a cheap yet efficient analog integrated circuit as the core and a standard thermistor as the front-end temperature sampling element. Just build it and watch its amazing performance. Cheers!