Introduction
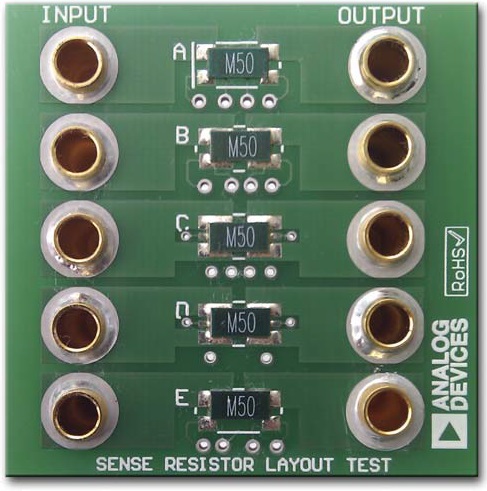
Current-sense resistors, which come in a variety of shapes and sizes, are used to measure current in many automotive, power control, and industrial systems. When using very low value resistors (a few milliohms or less), the resistance of the solder becomes a substantial portion of the sense element resistance and adds significantly to the measurement error. High-accuracy applications often use 4-terminal resistors and Kelvin sensing to reduce this error, but these special-purpose resistors can be expensive. In addition, the size and design of the resistor pads play a crucial role in determining the sense accuracy when measuring large currents. This article describes an alternative approach that enables high-accuracy Kelvin sensing using a standard, low-cost, 2-pad sense resistor with a 4-pad layout. Figure 1 shows the test board used to characterize the errors caused by five different layouts.
 |
|
| Figure 1. | Sense resistor layout test PCB. |
Current-Sense Resistor
Available in resistance values as low as 0.5 mΩ, commonly used current-sense resistors packaged in a 2512 case can dissipate up to 3 W. In order to highlight the worst-case errors, these experiments employ a 0.5-mΩ, 3-W resistor with 1% tolerance (part number ULRG3-2512-0M50-FLFSLT from Welwyn/TT Electronics). Its dimensions and the standard 4-wire footprint are shown in Figure 2.
 |
|
| Figure 2. | (a) ULRG3-2512-0M50-FLFSLT resistor dimensions; (b) Standard 4-pad footprint. |
Traditional Footprint
 |
|
| Figure 3. | Kelvin sensing. |
For Kelvin sensing, pads in the standard 2-wire footprint must be divided to provide separate paths for the system currents and the sense currents. Figure 3 shows an example of such a layout. The system current takes the path shown by the red arrows. If a simple 2-pad layout was used, the total resistance would be:
RTOTAL = RSENSE + (2 × RSOLDER)
To avoid the additional resistance, voltage sensing traces need to be routed right to the sense resistor pad. The system current will still cause a significant voltage drop across the upper solder joints, but the sense currents will cause a negligible voltage drop across the lower solder joints. This split pad approach thus removes the solder joint resistance from the measurement and improves the total system accuracy.
Optimizing the Kelvin Footprint
The layout shown in Figure 3 is a significant improvement on the standard 2-pad approach, but with very low value resistors (0.5 mΩ or less), the physical location of the sensing point on the pad and the symmetry of the current flow through the resistor become more significant. For example, the ULRG3-2512-0M50-FLFSLT is a solid metal-alloy resistor, so every millimeter of the resistor along the pad will influence the effective resistance. Using a calibrated current, an optimum sensing layout was determined by comparing the voltage drops across five custom footprints.
Test PCB
 |
|
| Figure 4. | Test PCB layout. |
Figure 4 shows five layout patterns, labeled A though E, created on a test PCB. Where possible, traces were routed to test points at different locations along the sense pads, as indicated by the color coded dots. The individual resistor footprints are:
A. Standard 4-wire resistor based on 2512 recommended footprints (see Figure 2(b)). Sense point pairs (X and Y) at the outer and inner edges of the pads (x-axis).
B. Similar to A but with pads elongated closer inwards to allow better coverage of the pad area (see Figure 2(a)). Sense points at the center and end of the pads.
C. Provides more symmetrical system current flow by using both sides of the pad. Also moves sense point to a more central location. Sense points are at the center and end of the pads.
D. Similar to C but with system current pads joined at the innermost point. Only the outer sense points are used.
E. Hybrid of A and B. The system current flows through the wider pads and the sense current flows through the smaller pads. Sense points are at the outer and inner edges of the pads.
Solder was applied using a stencil and reflowed in a reflow oven. The ULRG3-2512-0M50-FLFSLT resistor was used.
Test Procedure
The test setup is shown in Figure 5. A calibrated current of 20 A was passed through each resistor while the resistor was kept at. The resulting differential voltage was measured less than 1 second after the load current was enabled to prevent the resistor temperature from rising by more than 1 °C. The temperature of each resistor was monitored to ensure the test results were recorded at 25 °C. At 20 A, the ideal voltage drop across a 0.5-mΩ resistor is 10 mV.
 |
|
| Figure 5. | Test setup. |
Test Results
Table 1 shows the measured data using the sense pad locations shown in Figure 4.
| Table 1. | Measured Voltages and Errors | ||||||||||||||||||||||||||||||||||||||||
|
|||||||||||||||||||||||||||||||||||||||||
| *Without Kelvin sensing. Voltage was measured across the main high-current pad to demonstrate the error associated with the solder resistance. |
|||||||||||||||||||||||||||||||||||||||||
Observations
- Footprints C and D exhibit the lowest errors, with comparable results and variation within the individual resistor tolerance. Footprint C is preferred as it is less likely to cause problems related to component placement tolerances.
- The sense points at the outer extremity of the resistors provide the most accurate results in each case. This indicates the resistors are sized by the manufacturer to the entire length.
- Note the 22% error associated with the solder resistance without using Kelvin sensing. This is an equivalent solder resistance of about 0.144 mΩ.
- Footprint E demonstrates the effects of asymmetrical pad layout. During reflow, the component is pulled to the pad with the most solder. This type of footprint should be avoided.
Conclusion
Based on the results shown, the optimum footprint is C, with an expected measurement error of less than 1%. Recommended dimensions of this footprint are shown in Figure 6.
 |
|
| Figure 6. | Optimum footprint dimensions. |
The routing of the sense trace also had an impact on the measurement accuracy. To achieve the highest accuracy, the sense voltage should be measured at the edge of the resistor. Figure 7 shows a recommended layout using vias to route the outer edge of the pad to another layer, thus avoiding cutting the main power plane.
 |
|
| Figure 7. | Recommended PCB trace routing. |
The data in this article may not be applicable to all resistors, and results may vary, depending on resistor composition and size. Resistor manufacturers should be consulted. It is the responsibility of the user to ensure that the layout dimensions and structure of the footprint comply with individual SMT manufacturing requirements. Analog Devices, Inc., does not accept responsibility for any issues that may arise as a result of using this footprint.